MTF RSI & STOCH Strategy

1
Follow
1802
Followers
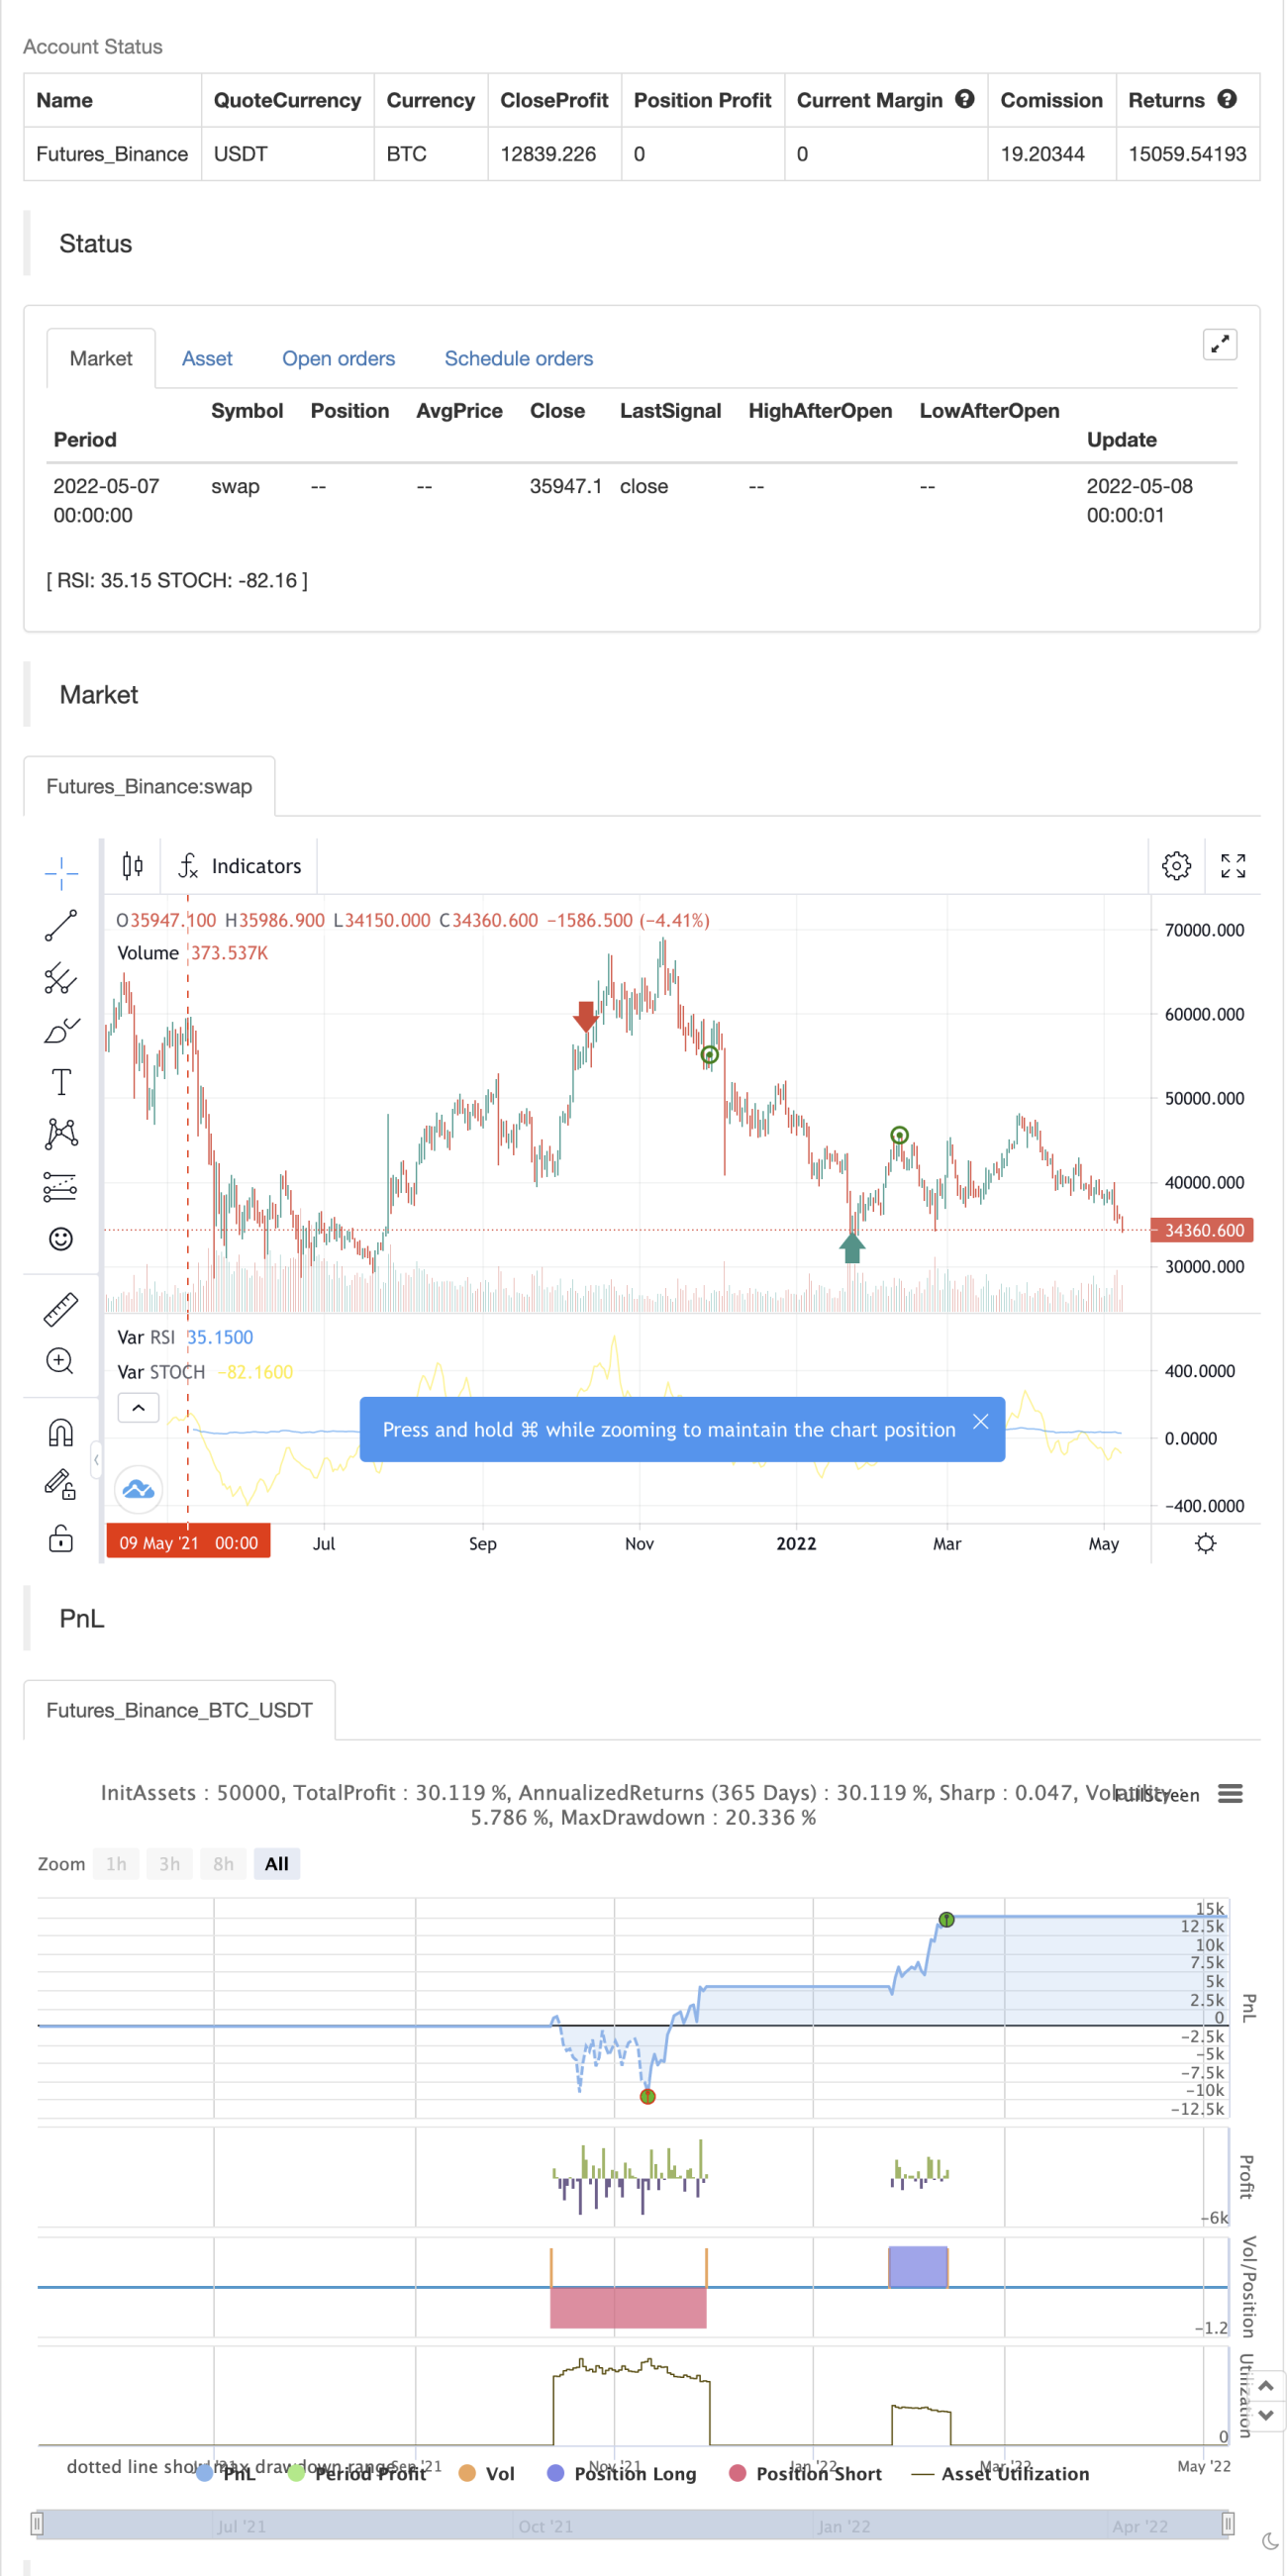
This sharing is an indicator where you can see the average of different time frames.
The RSI is the blue line
The Stock is the yellow line
You can manage the timeframe in the parameters.
The strategy is to take position when the two lines get overbought or oversold and close when the stoch and RSI goes to the middle.
backtest
Source
Pine
/*backtest
start: 2021-05-09 00:00:00
end: 2022-05-08 23:59:00
period: 1d
basePeriod: 1h
exchanges: [{"eid":"Futures_Binance","currency":"BTC_USDT"}]
*/

////////////////////////////////////////// MTF Stochastic & RSI Strategy ©️ bykzis /////////////////////////////////////////
//

// *** Inspired by "Binance CHOP Dashboard" from @Cazimiro and "RSI MTF Table" from @mobester16 *** and LOT OF COPY of Indicator-Jones MTF ScannerStrategy parameters
Related strategies
Comment
All comments (0)
No data
- 1