Mobo Bands

Author: ChaoZhang, Date: 2022-05-13 14:27:58
Tags: SMA

This indicator is the Mobo Bands (Momentum Breakout Bands). These bands are bollinger bands that have an adjusted standard deviation. There are Buy signals when it has momentum breakouts above the bands for moves to the upside and Sell signals when it has momentum breakouts below the bands for moves to the downside. The bands simply suggest that all markets have periods of chop which we all know to be true. While the price is inside the bands it is said to be trendless. Once the breakouts happen you can take trades in the breakout direction. I like to use these to swing trade options on the hourly timeframe but the bands should work on most instruments and timeframes. I like to use it to take swings on SPY on the 1 hour chart for entries and use the Daily chart for trend confirmation.
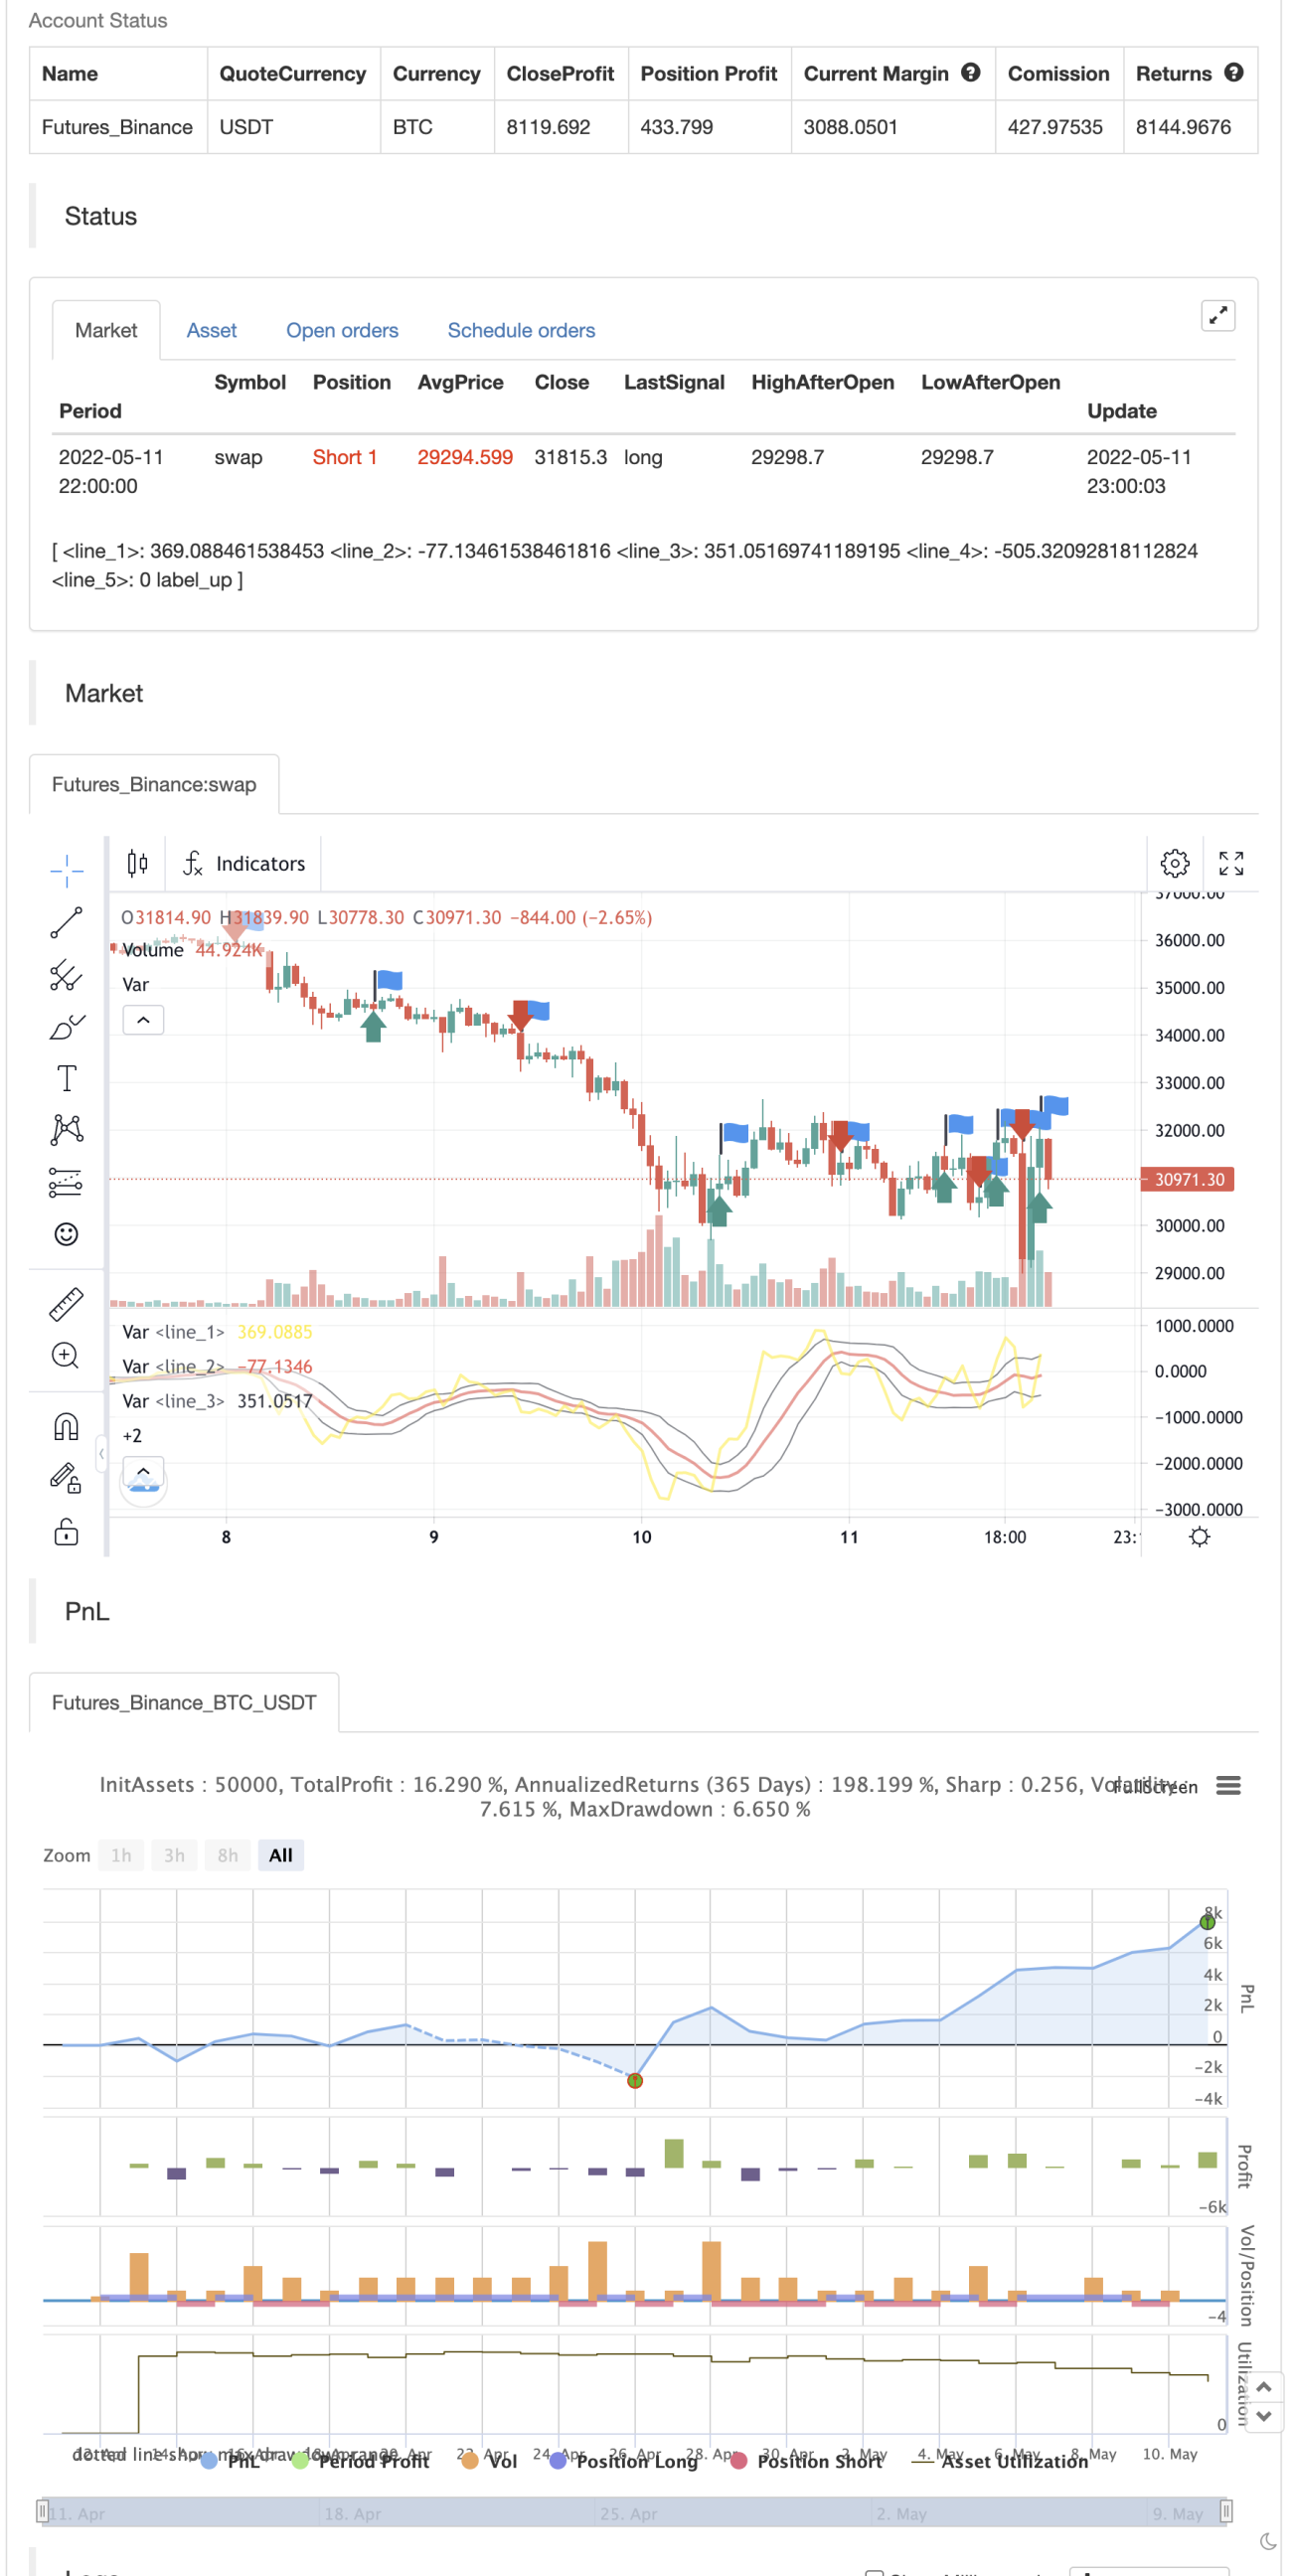
backtest

img


/*backtest
start: 2022-04-12 00:00:00
end: 2022-05-11 23:59:00
period: 1h
basePeriod: 15m
exchanges: [{"eid":"Futures_Binance","currency":"BTC_USDT"}]
*/

//@version=4
study("Mobo Bands", overlay=false)

price           = input(hl2, "Price")
colorNormLength = input(3, "colorNormLength", input.integer)
dpoLength       = input(13, "dpoLength", input.integer)
moboDisplace    = input(0, "moboDisplace", input.integer)
moboLength    = input(10, "moboLength", input.integer)

numDevDn  = input(-0.8, "numDevDn", input.float)
numDevUp  = input(0.8, "numDevUp", input.float)

coloredMobo     = input(true, "coloredMobo")
coloredFill     = input(true, "coloredFill")
breakArrows     = input(true, "breakArrows")
moboShowMid     = input(true, "moboShowMid") 


//def DPO = price - Average(price[DPO_length / 2 + 1], DPO_length);
xsma = sma(price[int(dpoLength / 2 + 1)], dpoLength) 
//alert(int(dpoLength / 2 + 1))
//xsma = sma(price, dpoLength) 
DPO = price - xsma


Midline = sma(DPO, moboLength)

sDev = stdev(DPO, moboLength)

LowerBand = Midline + numDevDn * sDev
UpperBand = Midline + numDevUp * sDev

plot(DPO, color=color.yellow,linewidth=2)

plot(Midline, color=Midline > Midline[1] ? color.lime : color.red,linewidth=2)

Upper = plot(UpperBand, color=color.black,linewidth=1)
Lower = plot(LowerBand, color=color.black,linewidth=1)

plot(0, color=color.white,linewidth=1)

Signal1 = DPO > UpperBand and DPO[1] < UpperBand[1]
Signal2 = DPO < LowerBand and DPO[1] > LowerBand[1]

wasUp = 1
wasDn = 1

wasUp := Signal1 ? 1 : (Signal2 ? 0 : nz(wasUp[1]))
wasDn := Signal2 ? 1 : (Signal1 ? 0 : nz(wasDn[1]))

//plotshape(Signal1 and wasDn[1] ? UpperBand : na, style=shape.arrowup, location=location.absolute, size=size.normal, color=color.red)
//plotshape(Signal2 and wasUp[1] ? LowerBand : na, style=shape.arrowdown, location=location.absolute, size=size.normal, color=color.green)

plotshape(Signal1 and wasDn[1] ? UpperBand : na, style=shape.labelup, location=location.absolute, size=size.normal, color=color.green, text="Buy",textcolor=color.white)
plotshape(Signal2 and wasUp[1] ? LowerBand : na, style=shape.labeldown, location=location.absolute, size=size.normal, color=color.red, text="Sell",textcolor=color.white)


//fill(Upper, Lower, color=color.purple)

alertcondition(Signal1 and wasDn[1], "Break Out Arrow", "Break Out Arrow")
alertcondition(Signal2 and wasUp[1], "Break Down Arrow", "Break Down Arrow")


if Signal1 and wasDn[1] 
    strategy.entry("Enter Long", strategy.long)
else if Signal2 and wasUp[1]
    strategy.entry("Enter Short", strategy.short)

Related

More