VuManChu Cipher B + Divergences Strategy

Author: ChaoZhang, Date: 2022-05-17 15:20:13
Tags: RSIEMAMACDADX

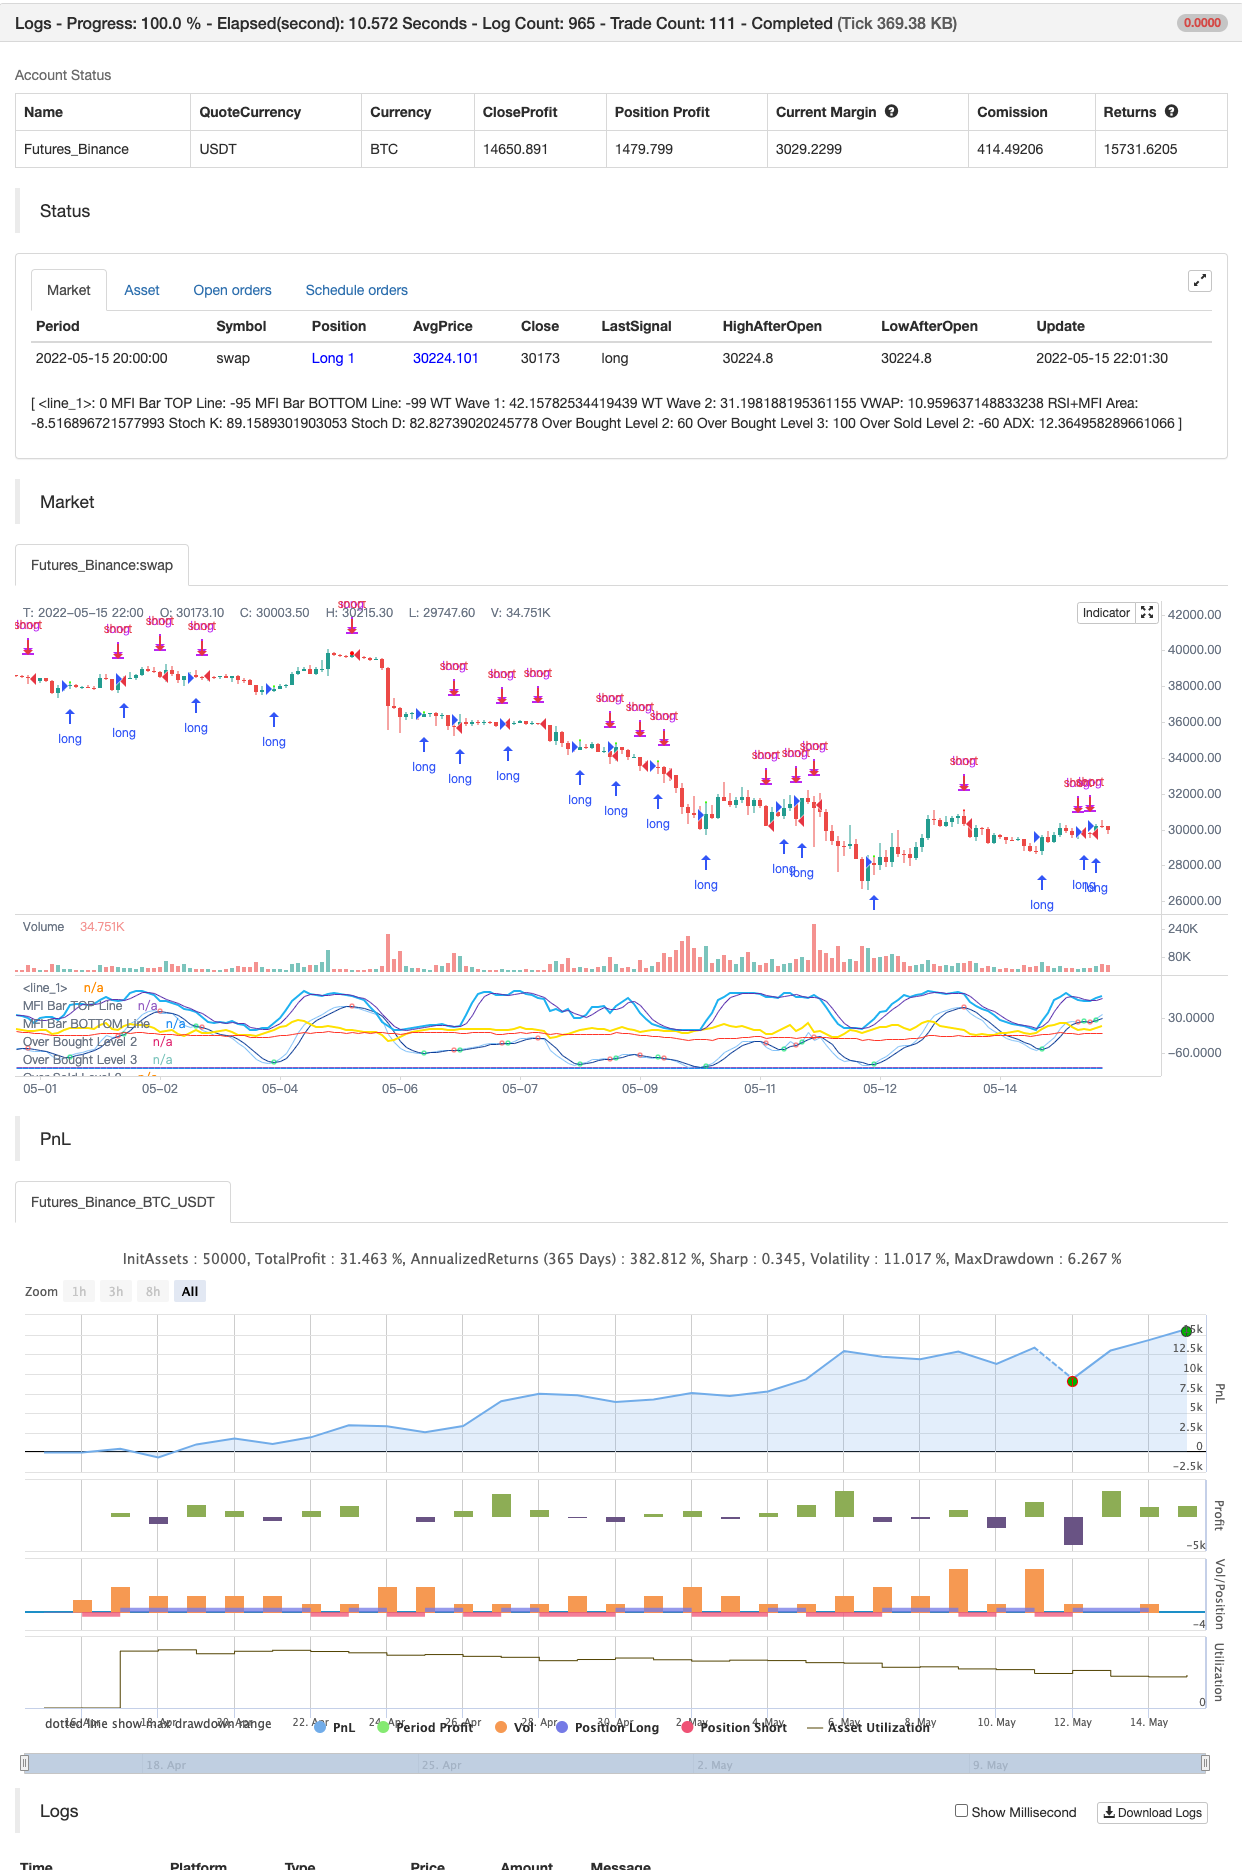
A Strategy using VuManChu Cipher B + Divergences for backtesting purpose.

backtest

img


/*backtest
start: 2022-04-16 00:00:00
end: 2022-05-15 23:59:00
period: 2h
basePeriod: 15m
exchanges: [{"eid":"Futures_Binance","currency":"BTC_USDT"}]
*/

// This source code is subject to the terms of the Mozilla Public License 2.0 at https://mozilla.org/MPL/2.0/
// © vumanchu

//@version=4


//  Thanks to dynausmaux for the code
//  Thanks to falconCoin for https://www.tradingview.com/script/KVfgBvDd-Market-Cipher-B-Free-version-with-Buy-and-sell/ inspired me to start this.
//  Thanks to LazyBear for WaveTrend Oscillator https://www.tradingview.com/script/2KE8wTuF-Indicator-WaveTrend-Oscillator-WT/
//  Thanks to RicardoSantos for https://www.tradingview.com/script/3oeDh0Yq-RS-Price-Divergence-Detector-V2/
//  Thanks to LucemAnb for Plain Stochastic Divergence https://www.tradingview.com/script/FCUgF8ag-Plain-Stochastic-Divergence/
//  Thanks to andreholanda73 for MFI+RSI Area https://www.tradingview.com/script/UlGZzUAr/
//  I especially want to thank TradingView for its platform that facilitates development and learning.

//
//  CIRCLES & TRIANGLES:
//    - LITTLE CIRCLE: They appear at all WaveTrend wave crossings.
//    - GREEN CIRCLE: The wavetrend waves are at the oversold level and have crossed up (bullish).
//    - RED CIRCLE: The wavetrend waves are at the overbought level and have crossed down (bearish).
//    - GOLD/ORANGE CIRCLE: When RSI is below 20, WaveTrend waves are below or equal to -80 and have crossed up after good bullish divergence (DONT BUY WHEN GOLD CIRCLE APPEAR).
//    - None of these circles are certain signs to trade. It is only information that can help you. 
//    - PURPLE TRIANGLE: Appear when a bullish or bearish divergence is formed and WaveTrend waves crosses at overbought and oversold points.
//
//  NOTES:
//    - I am not an expert trader or know how to program pine script as such, in fact it is my first indicator only to study and all the code is copied and modified from other codes that are published in TradingView.
//    - I am very grateful to the entire TV community that publishes codes so that other newbies like me can learn and present their results. This is an attempt to imitate Market Cipher B. 
//    - Settings by default are for 4h timeframe, divergences are more stronger and accurate. Haven't tested in all timeframes, only 2h and 4h.
//    - If you get an interesting result in other timeframes I would be very grateful if you would comment your configuration to implement it or at least check it.
//
//  CONTRIBUTIONS:
//    - Tip/Idea: Add higher timeframe analysis for bearish/bullish patterns at the current timeframe.
//    + Bearish/Bullish FLAG:
//      - MFI+RSI Area are RED (Below 0).
//      - Wavetrend waves are above 0 and crosses down.
//      - VWAP Area are below 0 on higher timeframe.
//      - This pattern reversed becomes bullish.
//    - Tip/Idea: Check the last heikinashi candle from 2 higher timeframe
//    + Bearish/Bullish DIAMOND:
//      - HT Candle is red
//      - WT > 0 and crossed down

// study(title = 'VuManChu B Divergences', shorttitle = 'VMC Cipher_B_Divergences')

// PARAMETERS {

// WaveTrend
wtShow = input(true, title = 'Show WaveTrend', type = input.bool)
wtBuyShow = input(true, title = 'Show Buy dots', type = input.bool)
wtGoldShow = input(true, title = 'Show Gold dots', type = input.bool)
wtSellShow = input(true, title = 'Show Sell dots', type = input.bool)
wtDivShow = input(true, title = 'Show Div. dots', type = input.bool)
vwapShow = input(true, title = 'Show Fast WT', type = input.bool)
wtChannelLen = input(9, title = 'WT Channel Length', type = input.integer)
wtAverageLen = input(12, title = 'WT Average Length', type = input.integer)
wtMASource = input(hlc3, title = 'WT MA Source', type = input.source)
wtMALen = input(3, title = 'WT MA Length', type = input.integer)

// WaveTrend Overbought & Oversold lines
obLevel = input(53, title = 'WT Overbought Level 1', type = input.integer)
obLevel2 = input(60, title = 'WT Overbought Level 2', type = input.integer)
obLevel3 = input(100, title = 'WT Overbought Level 3', type = input.integer)
osLevel = input(-53, title = 'WT Oversold Level 1', type = input.integer)
osLevel2 = input(-60, title = 'WT Oversold Level 2', type = input.integer)
osLevel3 = input(-75, title = 'WT Oversold Level 3', type = input.integer)

// Divergence WT
wtShowDiv = input(true, title = 'Show WT Regular Divergences', type = input.bool)
wtShowHiddenDiv = input(false, title = 'Show WT Hidden Divergences', type = input.bool)
showHiddenDiv_nl = input(true, title = 'Not apply OB/OS Limits on Hidden Divergences', type = input.bool)
wtDivOBLevel = input(45, title = 'WT Bearish Divergence min', type = input.integer)
wtDivOSLevel = input(-65, title = 'WT Bullish Divergence min', type = input.integer)

// Divergence extra range
wtDivOBLevel_addshow = input(true, title = 'Show 2nd WT Regular Divergences', type = input.bool)
wtDivOBLevel_add = input(15, title = 'WT 2nd Bearish Divergence', type = input.integer)
wtDivOSLevel_add = input(-40, title = 'WT 2nd Bullish Divergence 15 min', type = input.integer)

// RSI+MFI
rsiMFIShow = input(true, title = 'Show MFI', type = input.bool)
rsiMFIperiod = input(60,title = 'MFI Period', type = input.integer)
rsiMFIMultiplier = input(150, title = 'MFI Area multiplier', type = input.float)
rsiMFIPosY = input(2.5, title = 'MFI Area Y Pos', type = input.float)

// RSI
rsiShow = input(false, title = 'Show RSI', type = input.bool)
rsiSRC = input(close, title = 'RSI Source', type = input.source)
rsiLen = input(14, title = 'RSI Length', type = input.integer)
rsiOversold = input(30, title = 'RSI Oversold', minval = 50, maxval = 100, type = input.integer)
rsiOverbought = input(60, title = 'RSI Overbought', minval = 0, maxval = 50, type = input.integer)

// Divergence RSI
rsiShowDiv = input(false, title = 'Show RSI Regular Divergences', type = input.bool)
rsiShowHiddenDiv = input(false, title = 'Show RSI Hidden Divergences', type = input.bool)
rsiDivOBLevel = input(60, title = 'RSI Bearish Divergence min', type = input.integer)
rsiDivOSLevel = input(30, title = 'RSI Bullish Divergence min', type = input.integer)

// RSI Stochastic
stochShow = input(true, title = 'Show Stochastic RSI', type = input.bool)
stochUseLog = input(true, title=' Use Log?', type = input.bool)
stochAvg = input(false, title='Use Average of both K & D', type = input.bool)
stochSRC = input(close, title = 'Stochastic RSI Source', type = input.source)
stochLen = input(14, title = 'Stochastic RSI Length', type = input.integer)
stochRsiLen = input(14, title = 'RSI Length ', type = input.integer)
stochKSmooth = input(3, title = 'Stochastic RSI K Smooth', type = input.integer)
stochDSmooth = input(3, title = 'Stochastic RSI D Smooth', type = input.integer)

// Divergence stoch
stochShowDiv = input(false, title = 'Show Stoch Regular Divergences', type = input.bool)
stochShowHiddenDiv = input(false, title = 'Show Stoch Hidden Divergences', type = input.bool)

// Schaff Trend Cycle
tcLine = input(false, title="Show Schaff TC line", type=input.bool)
tcSRC = input(close, title = 'Schaff TC Source', type = input.source)
tclength = input(10, title="Schaff TC", type=input.integer)
tcfastLength = input(23, title="Schaff TC Fast Lenght", type=input.integer)
tcslowLength = input(50, title="Schaff TC Slow Length", type=input.integer)
tcfactor = input(0.5, title="Schaff TC Factor", type=input.float)

// Sommi Flag
sommiFlagShow = input(false, title = 'Show Sommi flag', type = input.bool)
sommiShowVwap = input(false, title = 'Show Sommi F. Wave', type = input.bool)
sommiVwapTF = input('720', title = 'Sommi F. Wave timeframe', type = input.string)
sommiVwapBearLevel = input(0, title = 'F. Wave Bear Level (less than)', type = input.integer)
sommiVwapBullLevel = input(0, title = 'F. Wave Bull Level (more than)', type = input.integer)
soomiFlagWTBearLevel = input(0, title = 'WT Bear Level (more than)', type = input.integer) 
soomiFlagWTBullLevel = input(0, title = 'WT Bull Level (less than)', type = input.integer) 
soomiRSIMFIBearLevel = input(0, title = 'Money flow Bear Level (less than)', type = input.integer) 
soomiRSIMFIBullLevel = input(0, title = 'Money flow Bull Level (more than)', type = input.integer) 

// Sommi Diamond
sommiDiamondShow = input(false, title = 'Show Sommi diamond', type = input.bool)
sommiHTCRes = input('60', title = 'HTF Candle Res. 1', type = input.string)
sommiHTCRes2 = input('240', title = 'HTF Candle Res. 2', type = input.string)
soomiDiamondWTBearLevel = input(0, title = 'WT Bear Level (More than)', type = input.integer)
soomiDiamondWTBullLevel = input(0, title = 'WT Bull Level (Less than)', type = input.integer)

// macd Colors
macdWTColorsShow = input(false, title = 'Show MACD Colors', type = input.bool)
macdWTColorsTF = input('240', title = 'MACD Colors MACD TF', type = input.string)

darkMode = input(false, title = 'Dark mode', type = input.bool)


// Colors
colorRed = #ff0000
colorPurple = #e600e6
colorGreen = #3fff00
colorOrange = #e2a400
colorYellow = #ffe500
colorWhite = #ffffff
colorPink = #ff00f0
colorBluelight = #31c0ff

colorWT1 = #90caf9
colorWT2 = #0d47a1

colorWT2_ = #131722

colormacdWT1a = #4caf58
colormacdWT1b = #af4c4c
colormacdWT1c = #7ee57e
colormacdWT1d = #ff3535

colormacdWT2a = #305630
colormacdWT2b = #310101
colormacdWT2c = #132213
colormacdWT2d = #770000

// } PARAMETERS


// FUNCTIONS {
  
// Divergences 
f_top_fractal(src) => src[4] < src[2] and src[3] < src[2] and src[2] > src[1] and src[2] > src[0]
f_bot_fractal(src) => src[4] > src[2] and src[3] > src[2] and src[2] < src[1] and src[2] < src[0]
f_fractalize(src) => f_top_fractal(src) ? 1 : f_bot_fractal(src) ? -1 : 0

f_findDivs(src, topLimit, botLimit, useLimits) =>
    fractalTop = f_fractalize(src) > 0 and (useLimits ? src[2] >= topLimit : true) ? src[2] : na
    fractalBot = f_fractalize(src) < 0 and (useLimits ? src[2] <= botLimit : true) ? src[2] : na
    highPrev = valuewhen(fractalTop, src[2], 0)[2]
    highPrice = valuewhen(fractalTop, high[2], 0)[2]
    lowPrev = valuewhen(fractalBot, src[2], 0)[2]
    lowPrice = valuewhen(fractalBot, low[2], 0)[2]
    bearSignal = fractalTop and high[2] > highPrice and src[2] < highPrev
    bullSignal = fractalBot and low[2] < lowPrice and src[2] > lowPrev
    bearDivHidden = fractalTop and high[2] < highPrice and src[2] > highPrev
    bullDivHidden = fractalBot and low[2] > lowPrice and src[2] < lowPrev
    [fractalTop, fractalBot, lowPrev, bearSignal, bullSignal, bearDivHidden, bullDivHidden]
        
// RSI+MFI
f_rsimfi(_period, _multiplier, _tf) => security(syminfo.tickerid, _tf, sma(((close - open) / (high - low)) * _multiplier, _period) - rsiMFIPosY)
   
// WaveTrend
f_wavetrend(src, chlen, avg, malen, tf) =>
    tfsrc = security(syminfo.tickerid, tf, src)
    esa = ema(tfsrc, chlen)
    de = ema(abs(tfsrc - esa), chlen)
    ci = (tfsrc - esa) / (0.015 * de)
    wt1 = security(syminfo.tickerid, tf, ema(ci, avg))
    wt2 = security(syminfo.tickerid, tf, sma(wt1, malen))
    wtVwap = wt1 - wt2
    wtOversold = wt2 <= osLevel
    wtOverbought = wt2 >= obLevel
    wtCross = cross(wt1, wt2)
    wtCrossUp = wt2 - wt1 <= 0
    wtCrossDown = wt2 - wt1 >= 0
    wtCrosslast = cross(wt1[2], wt2[2])
    wtCrossUplast = wt2[2] - wt1[2] <= 0
    wtCrossDownlast = wt2[2] - wt1[2] >= 0
    [wt1, wt2, wtOversold, wtOverbought, wtCross, wtCrossUp, wtCrossDown, wtCrosslast, wtCrossUplast, wtCrossDownlast, wtVwap]

// Schaff Trend Cycle
f_tc(src, length, fastLength, slowLength) =>
    ema1 = ema(src, fastLength)
    ema2 = ema(src, slowLength)
    macdVal = ema1 - ema2	
    alpha = lowest(macdVal, length)
    beta = highest(macdVal, length) - alpha
    gamma = (macdVal - alpha) / beta * 100
    gamma := beta > 0 ? gamma : nz(gamma[1])
    delta = gamma
    delta := na(delta[1]) ? delta : delta[1] + tcfactor * (gamma - delta[1])
    epsilon = lowest(delta, length)
    zeta = highest(delta, length) - epsilon
    eta = (delta - epsilon) / zeta * 100
    eta := zeta > 0 ? eta : nz(eta[1])
    stcReturn = eta
    stcReturn := na(stcReturn[1]) ? stcReturn : stcReturn[1] + tcfactor * (eta - stcReturn[1])
    stcReturn

// Stochastic RSI
f_stochrsi(_src, _stochlen, _rsilen, _smoothk, _smoothd, _log, _avg) =>
    src = _log ? log(_src) : _src
    rsi = rsi(src, _rsilen)
    kk = sma(stoch(rsi, rsi, rsi, _stochlen), _smoothk)
    d1 = sma(kk, _smoothd)
    avg_1 = avg(kk, d1)
    k = _avg ? avg_1 : kk
    [k, d1]

// MACD
f_macd(src, fastlen, slowlen, sigsmooth, tf) =>
    fast_ma = security(syminfo.tickerid, tf, ema(src, fastlen))
    slow_ma = security(syminfo.tickerid, tf, ema(src, slowlen))
    macd = fast_ma - slow_ma,
    signal = security(syminfo.tickerid, tf, sma(macd, sigsmooth))
    hist = macd - signal
    [macd, signal, hist]

// MACD Colors on WT    
f_macdWTColors(tf) =>
    hrsimfi = f_rsimfi(rsiMFIperiod, rsiMFIMultiplier, tf)
    [macd, signal, hist] = f_macd(close, 28, 42, 9, macdWTColorsTF)
    macdup = macd >= signal
    macddown = macd <= signal
    macdWT1Color = macdup ? hrsimfi > 0 ? colormacdWT1c : colormacdWT1a : macddown ? hrsimfi < 0 ? colormacdWT1d : colormacdWT1b : na
    macdWT2Color = macdup ? hrsimfi < 0 ? colormacdWT2c : colormacdWT2a : macddown ? hrsimfi < 0 ? colormacdWT2d : colormacdWT2b : na 
    [macdWT1Color, macdWT2Color]
    
// Get higher timeframe candle
f_getTFCandle(_tf) => 
    _open  = security(heikinashi(syminfo.tickerid), _tf, open, barmerge.gaps_off, barmerge.lookahead_on)
    _close = security(heikinashi(syminfo.tickerid), _tf, close, barmerge.gaps_off, barmerge.lookahead_on)
    _high  = security(heikinashi(syminfo.tickerid), _tf, high, barmerge.gaps_off, barmerge.lookahead_on)
    _low   = security(heikinashi(syminfo.tickerid), _tf, low, barmerge.gaps_off, barmerge.lookahead_on)
    hl2   = (_high + _low) / 2.0
    newBar = change(_open)
    candleBodyDir = _close > _open
    [candleBodyDir, newBar]

// Sommi flag
f_findSommiFlag(tf, wt1, wt2, rsimfi, wtCross, wtCrossUp, wtCrossDown) =>    
    [hwt1, hwt2, hwtOversold, hwtOverbought, hwtCross, hwtCrossUp, hwtCrossDown, hwtCrosslast, hwtCrossUplast, hwtCrossDownlast, hwtVwap] = f_wavetrend(wtMASource, wtChannelLen, wtAverageLen, wtMALen, tf)      
    
    bearPattern = rsimfi < soomiRSIMFIBearLevel and
                   wt2 > soomiFlagWTBearLevel and 
                   wtCross and 
                   wtCrossDown and 
                   hwtVwap < sommiVwapBearLevel
                   
    bullPattern = rsimfi > soomiRSIMFIBullLevel and 
                   wt2 < soomiFlagWTBullLevel and 
                   wtCross and 
                   wtCrossUp and 
                   hwtVwap > sommiVwapBullLevel
    
    [bearPattern, bullPattern, hwtVwap]
    
f_findSommiDiamond(tf, tf2, wt1, wt2, wtCross, wtCrossUp, wtCrossDown) =>
    [candleBodyDir, newBar] = f_getTFCandle(tf)
    [candleBodyDir2, newBar2] = f_getTFCandle(tf2)
    bearPattern = wt2 >= soomiDiamondWTBearLevel and
                   wtCross and
                   wtCrossDown and
                   not candleBodyDir and
                   not candleBodyDir2                   
    bullPattern = wt2 <= soomiDiamondWTBullLevel and
                   wtCross and
                   wtCrossUp and
                   candleBodyDir and
                   candleBodyDir2 
    [bearPattern, bullPattern]
 
// } FUNCTIONS  

// CALCULATE INDICATORS {

// RSI
rsi = rsi(rsiSRC, rsiLen)
rsiColor = rsi <= rsiOversold ? colorGreen : rsi >= rsiOverbought ? colorRed : colorPurple

// RSI + MFI Area
rsiMFI = f_rsimfi(rsiMFIperiod, rsiMFIMultiplier, timeframe.period)
rsiMFIColor = rsiMFI > 0 ? #3ee145 : #ff3d2e

// Calculates WaveTrend
[wt1, wt2, wtOversold, wtOverbought, wtCross, wtCrossUp, wtCrossDown, wtCross_last, wtCrossUp_last, wtCrossDown_last, wtVwap] = f_wavetrend(wtMASource, wtChannelLen, wtAverageLen, wtMALen, timeframe.period)
 
// Stochastic RSI
[stochK, stochD] = f_stochrsi(stochSRC, stochLen, stochRsiLen, stochKSmooth, stochDSmooth, stochUseLog, stochAvg)

// Schaff Trend Cycle
tcVal = f_tc(tcSRC, tclength, tcfastLength, tcslowLength)

// Sommi flag
[sommiBearish, sommiBullish, hvwap] = f_findSommiFlag(sommiVwapTF, wt1, wt2, rsiMFI, wtCross,  wtCrossUp, wtCrossDown)

//Sommi diamond
[sommiBearishDiamond, sommiBullishDiamond] = f_findSommiDiamond(sommiHTCRes, sommiHTCRes2, wt1, wt2, wtCross, wtCrossUp, wtCrossDown)

// macd colors
[macdWT1Color, macdWT2Color] = f_macdWTColors(macdWTColorsTF)

// WT Divergences
[wtFractalTop, wtFractalBot, wtLow_prev, wtBearDiv, wtBullDiv, wtBearDivHidden, wtBullDivHidden] = f_findDivs(wt2, wtDivOBLevel, wtDivOSLevel, true)
    
[wtFractalTop_add, wtFractalBot_add, wtLow_prev_add, wtBearDiv_add, wtBullDiv_add, wtBearDivHidden_add, wtBullDivHidden_add] =  f_findDivs(wt2, wtDivOBLevel_add, wtDivOSLevel_add, true)
[wtFractalTop_nl, wtFractalBot_nl, wtLow_prev_nl, wtBearDiv_nl, wtBullDiv_nl, wtBearDivHidden_nl, wtBullDivHidden_nl] =  f_findDivs(wt2, 0, 0, false)

wtBearDivHidden_ = showHiddenDiv_nl ? wtBearDivHidden_nl : wtBearDivHidden
wtBullDivHidden_ = showHiddenDiv_nl ? wtBullDivHidden_nl : wtBullDivHidden

wtBearDivColor = (wtShowDiv and wtBearDiv) or (wtShowHiddenDiv and wtBearDivHidden_) ? colorRed : na
wtBullDivColor = (wtShowDiv and wtBullDiv) or (wtShowHiddenDiv and wtBullDivHidden_) ? colorGreen : na

wtBearDivColor_add = (wtShowDiv and (wtDivOBLevel_addshow and wtBearDiv_add)) or (wtShowHiddenDiv and (wtDivOBLevel_addshow and wtBearDivHidden_add)) ? #9a0202 : na
wtBullDivColor_add = (wtShowDiv and (wtDivOBLevel_addshow and wtBullDiv_add)) or (wtShowHiddenDiv and (wtDivOBLevel_addshow and wtBullDivHidden_add)) ? #1b5e20 : na

// RSI Divergences
[rsiFractalTop, rsiFractalBot, rsiLow_prev, rsiBearDiv, rsiBullDiv, rsiBearDivHidden, rsiBullDivHidden] = f_findDivs(rsi, rsiDivOBLevel, rsiDivOSLevel, true)
[rsiFractalTop_nl, rsiFractalBot_nl, rsiLow_prev_nl, rsiBearDiv_nl, rsiBullDiv_nl, rsiBearDivHidden_nl, rsiBullDivHidden_nl] = f_findDivs(rsi, 0, 0, false)

rsiBearDivHidden_ = showHiddenDiv_nl ? rsiBearDivHidden_nl : rsiBearDivHidden
rsiBullDivHidden_ = showHiddenDiv_nl ? rsiBullDivHidden_nl : rsiBullDivHidden

rsiBearDivColor = (rsiShowDiv and rsiBearDiv) or (rsiShowHiddenDiv and rsiBearDivHidden_) ? colorRed : na
rsiBullDivColor = (rsiShowDiv and rsiBullDiv) or (rsiShowHiddenDiv and rsiBullDivHidden_) ? colorGreen : na
 
// Stoch Divergences
[stochFractalTop, stochFractalBot, stochLow_prev, stochBearDiv, stochBullDiv, stochBearDivHidden, stochBullDivHidden] = f_findDivs(stochK, 0, 0, false)

stochBearDivColor = (stochShowDiv and stochBearDiv) or (stochShowHiddenDiv and stochBearDivHidden) ? colorRed : na
stochBullDivColor = (stochShowDiv and stochBullDiv) or (stochShowHiddenDiv and stochBullDivHidden) ? colorGreen : na


// Small Circles WT Cross
signalColor = wt2 - wt1 > 0 ? color.red : color.lime

// Buy signal.
buySignal = wtCross and wtCrossUp and wtOversold

buySignalDiv = (wtShowDiv and wtBullDiv) or 
               (wtShowDiv and wtBullDiv_add) or 
               (stochShowDiv and stochBullDiv) or 
               (rsiShowDiv and rsiBullDiv)
    
buySignalDiv_color = wtBullDiv ? colorGreen : 
                     wtBullDiv_add ? color.new(colorGreen, 60) : 
                     rsiShowDiv ? colorGreen : na

// Sell signal
sellSignal = wtCross and wtCrossDown and wtOverbought
             
sellSignalDiv = (wtShowDiv and wtBearDiv) or 
               (wtShowDiv and wtBearDiv_add) or
               (stochShowDiv and stochBearDiv) or
               (rsiShowDiv and rsiBearDiv)
                    
sellSignalDiv_color = wtBearDiv ? colorRed : 
                     wtBearDiv_add ? color.new(colorRed, 60) : 
                     rsiBearDiv ? colorRed : na

// Gold Buy 
lastRsi = valuewhen(wtFractalBot, rsi[2], 0)[2]
wtGoldBuy = ((wtShowDiv and wtBullDiv) or (rsiShowDiv and rsiBullDiv)) and
           wtLow_prev <= osLevel3 and
           wt2 > osLevel3 and
           wtLow_prev - wt2 <= -5 and
           lastRsi < 30           
          
// } CALCULATE INDICATORS


// DRAW {
bgcolor(darkMode ? color.new(#000000, 80) : na)
zLine = plot(0, color = color.new(colorWhite, 50))

//  MFI BAR
rsiMfiBarTopLine = plot(rsiMFIShow ? -95 : na, title = 'MFI Bar TOP Line', transp = 100)
rsiMfiBarBottomLine = plot(rsiMFIShow ? -99 : na, title = 'MFI Bar BOTTOM Line', transp = 100)
fill(rsiMfiBarTopLine, rsiMfiBarBottomLine, title = 'MFI Bar Colors', color = rsiMFIColor, transp = 75)

// WT Areas
plot(wtShow ? wt1 : na, style = plot.style_area, title = 'WT Wave 1', color = macdWTColorsShow ? macdWT1Color : colorWT1, transp = 0)
plot(wtShow ? wt2 : na, style = plot.style_area, title = 'WT Wave 2', color = macdWTColorsShow ? macdWT2Color : darkMode ? colorWT2_ : colorWT2 , transp = 20)

// VWAP
plot(vwapShow ? wtVwap : na, title = 'VWAP', color = colorYellow, style = plot.style_area, linewidth = 2, transp = 45)

// MFI AREA
rsiMFIplot = plot(rsiMFIShow ? rsiMFI: na, title = 'RSI+MFI Area', color = rsiMFIColor, transp = 20)
fill(rsiMFIplot, zLine, rsiMFIColor, transp = 40)

// WT Div

plot(series = wtFractalTop ? wt2[2] : na, title = 'WT Bearish Divergence', color = wtBearDivColor, linewidth = 2, offset = -2)
plot(series = wtFractalBot ? wt2[2] : na, title = 'WT Bullish Divergence', color = wtBullDivColor, linewidth = 2, offset = -2)

// WT 2nd Div
plot(series = wtFractalTop_add ? wt2[2] : na, title = 'WT 2nd Bearish Divergence', color = wtBearDivColor_add, linewidth = 2, offset = -2)
plot(series = wtFractalBot_add ? wt2[2] : na, title = 'WT 2nd Bullish Divergence', color = wtBullDivColor_add, linewidth = 2, offset = -2)

// RSI
plot(rsiShow ? rsi : na, title = 'RSI', color = rsiColor, linewidth = 2, transp = 25)

// RSI Div
plot(series = rsiFractalTop ? rsi[2] : na, title='RSI Bearish Divergence', color = rsiBearDivColor, linewidth = 1, offset = -2)
plot(series = rsiFractalBot ? rsi[2] : na, title='RSI Bullish Divergence', color = rsiBullDivColor, linewidth = 1, offset = -2)

// Stochastic RSI
stochKplot = plot(stochShow ? stochK : na, title = 'Stoch K', color = color.new(#21baf3, 0), linewidth = 2)
stochDplot = plot(stochShow ? stochD : na, title = 'Stoch D', color = color.new(#673ab7, 60), linewidth = 1)
stochFillColor = stochK >= stochD ? color.new(#21baf3, 75) : color.new(#673ab7, 60)
fill(stochKplot, stochDplot, title='KD Fill', color=stochFillColor)

// Stoch Div
plot(series = stochFractalTop ? stochK[2] : na, title='Stoch Bearish Divergence', color = stochBearDivColor, linewidth = 1, offset = -2)
plot(series = stochFractalBot ? stochK[2] : na, title='Stoch Bullish Divergence', color = stochBullDivColor, linewidth = 1, offset = -2)

// Schaff Trend Cycle
plot(tcLine ? tcVal : na, color = color.new(#673ab7, 25), linewidth = 2, title = "Schaff Trend Cycle 1")
plot(tcLine ? tcVal : na, color = color.new(colorWhite, 50), linewidth = 1, title = "Schaff Trend Cycle 2")


// Draw Overbought & Oversold lines
//plot(obLevel, title = 'Over Bought Level 1', color = colorWhite, linewidth = 1, style = plot.style_circles, transp = 85)
plot(obLevel2, title = 'Over Bought Level 2', color = colorWhite, linewidth = 1, style = plot.style_stepline, transp = 85)
plot(obLevel3, title = 'Over Bought Level 3', color = colorWhite, linewidth = 1, style = plot.style_circles, transp = 95)

//plot(osLevel, title = 'Over Sold Level 1', color = colorWhite, linewidth = 1, style = plot.style_circles, transp = 85)
plot(osLevel2, title = 'Over Sold Level 2', color = colorWhite, linewidth = 1, style = plot.style_stepline, transp = 85)

// Sommi flag
plotchar(sommiFlagShow and sommiBearish ? 108 : na, title = 'Sommi bearish flag', char='⚑', color = colorPink, location = location.absolute, size = size.tiny, transp = 0)
plotchar(sommiFlagShow and sommiBullish ? -108 : na, title = 'Sommi bullish flag', char='⚑', color = colorBluelight, location = location.absolute, size = size.tiny, transp = 0)
plot(sommiShowVwap ? ema(hvwap, 3) : na, title = 'Sommi higher VWAP', color = colorYellow, linewidth = 2, style = plot.style_line, transp = 15)

// Sommi diamond
plotchar(sommiDiamondShow and sommiBearishDiamond ? 108 : na, title = 'Sommi bearish diamond', char='◆', color = colorPink, location = location.absolute, size = size.tiny, transp = 0)
plotchar(sommiDiamondShow and sommiBullishDiamond ? -108 : na, title = 'Sommi bullish diamond', char='◆', color = colorBluelight, location = location.absolute, size = size.tiny, transp = 0)

// Circles
plot(wtCross ? wt2 : na, title = 'Buy and sell circle', color = signalColor, style = plot.style_circles, linewidth = 3, transp = 15)

plotchar(wtBuyShow and buySignal ? -107 : na, title = 'Buy circle', char='·', color = colorGreen, location = location.absolute, size = size.small, transp = 50)
plotchar(wtSellShow and sellSignal ? 105 : na , title = 'Sell circle', char='·', color = colorRed, location = location.absolute, size = size.small, transp = 50)

plotchar(wtDivShow and buySignalDiv ? -106 : na, title = 'Divergence buy circle', char='•', color = buySignalDiv_color, location = location.absolute, size = size.small, offset = -2, transp = 15)
plotchar(wtDivShow and sellSignalDiv ? 106 : na, title = 'Divergence sell circle', char='•', color = sellSignalDiv_color, location = location.absolute, size = size.small, offset = -2, transp = 15)

plotchar(wtGoldBuy and wtGoldShow ? -106 : na, title = 'Gold  buy gold circle', char='•', color = colorOrange, location = location.absolute, size = size.small, offset = -2, transp = 15)

// } DRAW


len = input(14)
th = input(20)

TrueRange = max(max(high-low, abs(high-nz(close[1]))), abs(low-nz(close[1])))
DirectionalMovementPlus = high-nz(high[1]) > nz(low[1])-low ? max(high-nz(high[1]), 0): 0
DirectionalMovementMinus = nz(low[1])-low > high-nz(high[1]) ? max(nz(low[1])-low, 0): 0

SmoothedTrueRange = 0.0
SmoothedTrueRange := nz(SmoothedTrueRange[1]) - (nz(SmoothedTrueRange[1])/len) + TrueRange

SmoothedDirectionalMovementPlus = 0.0
SmoothedDirectionalMovementPlus := nz(SmoothedDirectionalMovementPlus[1]) - (nz(SmoothedDirectionalMovementPlus[1])/len) + DirectionalMovementPlus

SmoothedDirectionalMovementMinus = 0.0
SmoothedDirectionalMovementMinus := nz(SmoothedDirectionalMovementMinus[1]) - (nz(SmoothedDirectionalMovementMinus[1])/len) + DirectionalMovementMinus

DIPlus = SmoothedDirectionalMovementPlus / SmoothedTrueRange * 100
DIMinus = SmoothedDirectionalMovementMinus / SmoothedTrueRange * 100
DX = abs(DIPlus-DIMinus) / (DIPlus+DIMinus)*100
ADX = sma(DX, len)

plot(ADX, color=color.white, title="ADX")


// ALERTS {
  
// BUY
// alertcondition(buySignal, 'Buy (Big green circle)', 'Green circle WaveTrend Oversold')
// alertcondition(buySignalDiv, 'Buy (Big green circle + Div)', 'Buy & WT Bullish Divergence & WT Overbought')
// alertcondition(wtGoldBuy, 'GOLD Buy (Big GOLDEN circle)', 'Green & GOLD circle WaveTrend Overbought')
// alertcondition(sommiBullish or sommiBullishDiamond, 'Sommi bullish flag/diamond', 'Blue flag/diamond')
// alertcondition(wtCross and wtCrossUp, 'Buy (Small green dot)', 'Buy small circle')

// SELL
// alertcondition(sommiBearish or sommiBearishDiamond, 'Sommi bearish flag/diamond', 'Purple flag/diamond')
// alertcondition(sellSignal, 'Sell (Big red circle)', 'Red Circle WaveTrend Overbought')
// alertcondition(sellSignalDiv, 'Sell (Big red circle + Div)', 'Buy & WT Bearish Divergence & WT Overbought')
// alertcondition(wtCross and wtCrossDown, 'Sell (Small red dot)', 'Sell small circle')

// } ALERTS

f_RelVol(_value, _length) =>
    min_value = lowest(_value, _length)
    max_value = highest(_value, _length)
    stoch(_value, max_value, min_value, _length) / 100

rsi1LengthInput = input(100, minval=1, title="RSI Length", group="RSI Settings")
rsi1SourceInput = input(close, "Source", group="RSI Settings")

rsi2LengthInput = input(25, minval=1, title="RSI Length", group="RSI Settings")
rsi2SourceInput = input(close, "Source", group="RSI Settings")

price   = close
length  = input(10, minval=1)
DER_avg = input(5, 'Average',   minval=1, inline='DER', group='Directional Energy Ratio')
smooth  = input(3, 'Smoothing', minval=1, inline='DER', group='Directional Energy Ratio')

v_calc  = input('Relative', 'Calculation', options=['Relative', 'Full', 'None'], group='Volume Parameters')
vlookbk = input(20, 'Lookback (for Relative)', minval=1, group='Volume Parameters')

uprsi1 = rma(max(change(rsi1SourceInput), 0), rsi1LengthInput)
uprsi2 = rma(max(change(rsi2SourceInput), 0), rsi2LengthInput)
downrsi1 = rma(-min(change(rsi1SourceInput), 0), rsi1LengthInput)
downrsi2 = rma(-min(change(rsi2SourceInput), 0), rsi2LengthInput)
rsi1 = downrsi1 == 0 ? 100 : uprsi1 == 0 ? 0 : 100 - (100 / (1 + uprsi1 / downrsi1))
rsi2 = downrsi2 == 0 ? 100 : uprsi2 == 0 ? 0 : 100 - (100 / (1 + uprsi2 / downrsi2))

vola    = 
  v_calc == 'None' or na(volume) ? 1 : 
  v_calc == 'Relative' ? f_RelVol(volume, vlookbk) : 
  volume

R       = (highest(1) - lowest(1)) / 2                    // R is the 2-bar average bar range
sr      = change(price) / R                                  // calc ratio of change to R
rsr     = max(min(sr, 1), -1)                         // ensure ratio is restricted to +1/-1 in case of big moves
c       = rsr * vola                                            // add volume accel

c_plus  = max(c, 0)                                        // calc directional vol-accel energy
c_minus = -min(c, 0)

// plot(c_plus)
// plot(c_minus)

dem     = wma(c_plus, length) / wma(vola, length)         //average directional energy ratio
sup     = wma(c_minus, length) / wma(vola, length)

// plot(vola, 'Vol Accel')

adp     = 1 * wma(dem, DER_avg)
asp     = 1 * wma(sup, DER_avg)

anp     = adp - asp
anp_s   = wma(anp, smooth)


// plot(rsi1, "RSI", color=#FF0033)
rsi1UpperBand = hline(70, "RSI Upper Band", color=#787B86)
// hline(50, "RSI Middle Band", color=color.new(#787B86, 50))
rsi1LowerBand = hline(30, "RSI Lower Band", color=#787B86)

// plot(rsi2, "RSI", color=#FFFF00)
rsi2UpperBand = hline(70, "RSI Upper Band", color=#787B86)
// hline(50, "RSI Middle Band", color=color.new(#787B86, 50))
rsi2LowerBand = hline(30, "RSI Lower Band", color=#787B86)

c_adp   = color.new(color.aqua, 50)
c_asp   = color.new(color.orange, 50)
c_zero  = color.new(color.yellow, 70)
c_fd    = color.new(color.green, 80)
c_fs    = color.new(color.red, 80)
c_up    = color.new(#33ff00, 0)
c_dn    = color.new(#ff1111, 0)
up      = anp_s >= 0

//strategy(title='VMC', shorttitle='VMC', overlay=true, precision=3, commission_value=0.025, default_qty_type=strategy.cash, default_qty_value=10000, initial_capital=10000)

//=== Buy/Sell ===
closeStatus = strategy.openprofit > 0 ? 'win' : 'lose'
// long_entry = (signalColor == color.lime and wtCross and up)
// long_exit_entry = (signalColor == color.red or sellSignal or sellSignalDiv)
// short_entry = (signalColor == color.red and wtCross and not up)
// short_exit_entry = (signalColor == color.lime or buySignal or buySignalDiv)

long_entry = wt2 < wt1 //and up and rsi2 > rsi1
long_exit_entry = signalColor == color.red or sellSignal or sellSignalDiv
short_entry = wt2 > wt1 //and not up and rsi2 < rsi1
short_exit_entry = signalColor == color.lime or buySignal or buySignalDiv

alertcondition(long_entry, 'Buy', 'Long entry')
alertcondition(long_exit_entry, 'Buy', 'Long exit')
alertcondition(short_entry, 'Sell', 'Short entry')
alertcondition(short_exit_entry, 'Sell', 'Short exit')

strategy.entry('long', strategy.long, when=long_entry)
strategy.close('long', when=long_exit_entry, comment=closeStatus)

strategy.entry('short', strategy.short, when=short_entry)
strategy.close('short', when=short_exit_entry, comment=closeStatus)

// stopPer = input(100, title='Stop Loss %', type=input.float) / 100
// takePer = input(100, title='Take Profit %', type=input.float) / 100

// // Determine where you've entered and in what direction
// longStop = strategy.position_avg_price * (1 - stopPer)
// shortStop = strategy.position_avg_price * (1 + stopPer)
// shortTake = strategy.position_avg_price * (1 - takePer)
// longTake = strategy.position_avg_price * (1 + takePer)

// if strategy.position_size > 0 
//     strategy.exit(id="Close Long", stop=longStop, limit=longTake)
// if strategy.position_size < 0 
//     strategy.exit(id="Close Short", stop=shortStop, limit=shortTake)

Related

More