
Overview
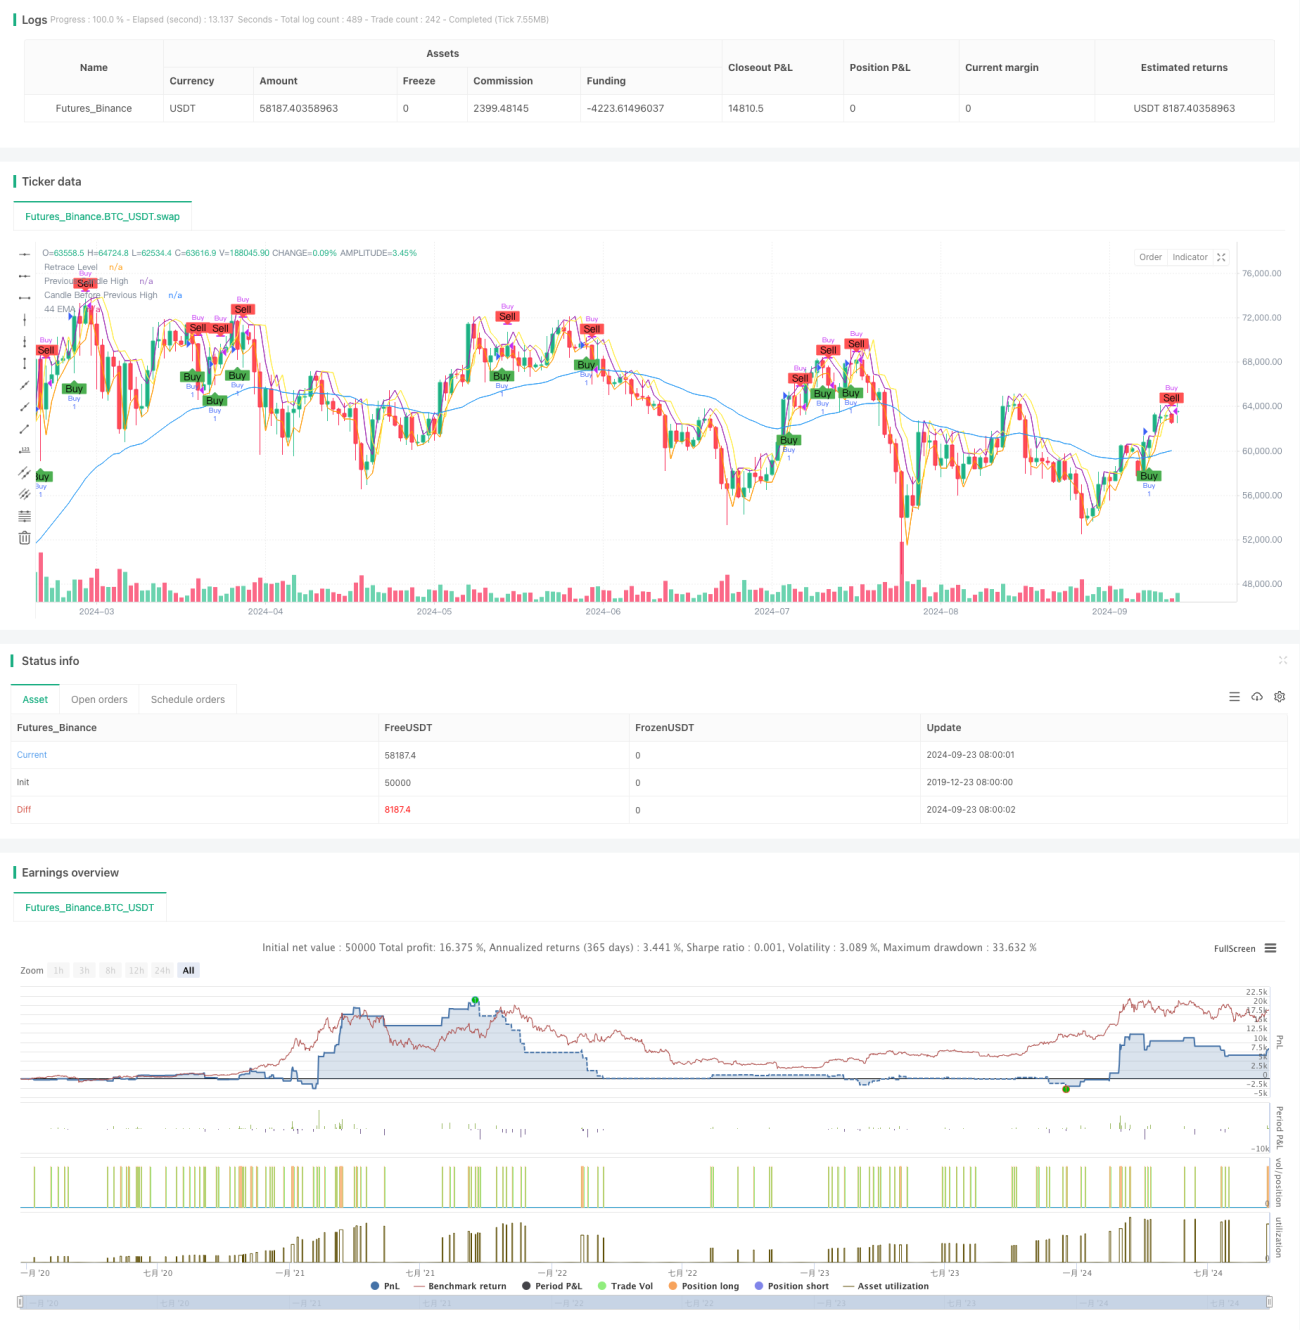
This is a trend-following strategy based on the 44-period Exponential Moving Average (EMA). The strategy primarily seeks buying opportunities in uptrends by analyzing multiple conditions including EMA slope, candlestick patterns, and price retracements. Designed for shorter timeframes such as 2-minute and 5-minute charts, it aims to capture trading opportunities in short-term price fluctuations.
Strategy Principles
- Calculate the 44-period EMA and its slope to determine if the trend is sufficiently inclined.
- Analyze the previous candle's pattern, requiring it to be bullish and close above the EMA.
- Observe if the current candle has retraced to 50% of the previous candle's body.
- Ensure the previous candle's close is higher than the high of the candle before it, validating the continuity of the uptrend.
- When all conditions are met, enter a long position at the retracement level of the current candle.
- Exit conditions: when the previous candle is bearish or the current candle's low breaks below the previous candle's low.
Strategy Advantages
- Multiple Filters: Combines EMA, candlestick patterns, and price retracements to effectively reduce false signals.
- Trend Following: Uses EMA slope to ensure trading in clear uptrends, improving win rate.
- Retracement Entry: Utilizes price pullbacks as entry points, optimizing buy prices and potentially increasing profit margins.
- Flexibility: Applicable to various timeframes, suitable for short-term and intraday traders.
- Risk Control: Implements clear stop-loss conditions, helping to control risk for each trade.
Strategy Risks
- Lag: EMA as a lagging indicator may not react timely in highly volatile markets.
- False Breakouts: May generate frequent false signals in sideways consolidation areas.
- Overtrading: High volatility markets might trigger too many trades, increasing transaction costs.
- Trend Reversals: Rapid trend reversals can lead to significant losses.
- Parameter Sensitivity: Strategy performance is sensitive to parameter settings like EMA period.
Optimization Directions
- Introduce Additional Filters: Such as RSI or MACD to further confirm trend strength and direction.
- Dynamic Stop-Loss: Implement ATR-based dynamic stop-loss to better adapt to market volatility.
- Incorporate Volume Analysis: Integrate volume indicators to enhance entry signal reliability.
- Optimize EMA Period: Backtest different EMA periods to find the optimal parameter combination.
- Add Trend Strength Indicator: Such as ADX to ensure entries only in strong trends.
- Improve Exit Mechanism: Design more sophisticated profit-taking strategies, like trailing stops.
Summary
The Gaussian Cross EMA Trend Retracement Strategy is a trend-following system that combines multiple technical indicators. By integrating EMA, candlestick pattern analysis, and price retracements, this strategy shows good potential in identifying uptrends and optimizing entry timing. However, users need to be cautious about overtrading risks and optimize parameters for different market environments. By introducing additional technical indicators and improving risk management mechanisms, this strategy has the potential to achieve more stable performance in short-term trading.
- 1