Volume Flow v3

Author: ChaoZhang, Date: 2022-05-23 14:40:50
Tags: EMADEMA

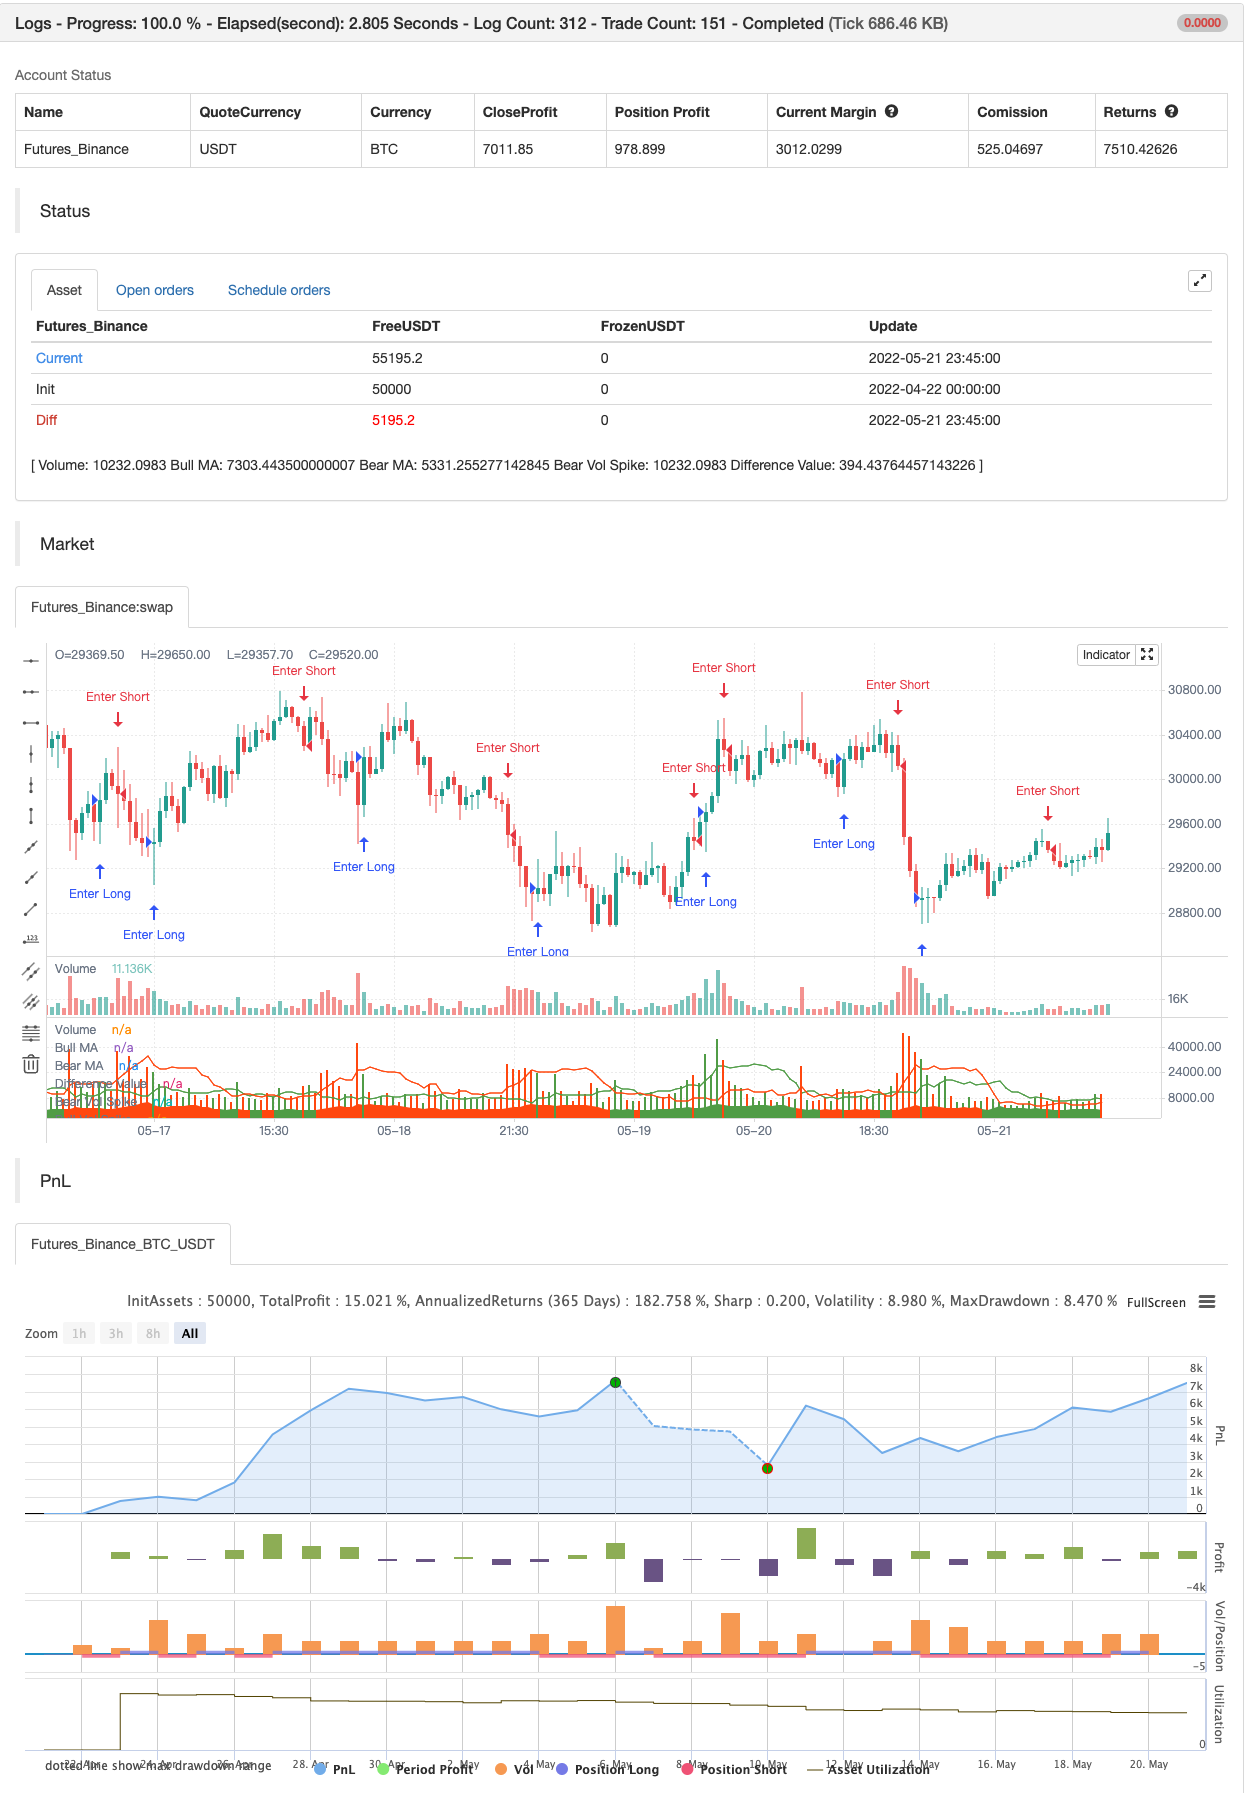
DepthHouse Volume Flow indicator is used to help determine trend direction strictly based on Negative and Positive volume data.

How to Read:

  • Moving Average crossovers are used to help determine a possible trend change or retracement.
  • The area cloud on the bottom is calculated by the difference of the moving averages. This could be used to help determine the trending volume strength.
  • Bright colored volume bars are large volume spikes calculated by the x factor in the options.

Other changes:

  • DepthHouse is going open source with numerous of its indicators. This is only one of many!
  • Volume is now displayed without being altered for calculations.

backtest

img


/*backtest
start: 2022-04-22 00:00:00
end: 2022-05-21 23:59:00
period: 45m
basePeriod: 5m
exchanges: [{"eid":"Futures_Binance","currency":"BTC_USDT"}]
*/

//@version=4
//DepthHouse Trading Indicators
// by oh92
study("Volume Flow v3", shorttitle="Volume Flow [DepthHouse]")

maType =    input(title="Moving Average Type", options=["Simple", "Exponential", "Double Exponential"], defval="Simple")
length =    input(14, title="MA Length")
x      =    input(3.1, title="Factor For Breakout Candle")

//////////////////////////
// oh92 favorite colors //
//////////////////////////
red   = #FF510D      //#ff848a // #FA8072 // #323433 // #ff848a
green = #5AA650      // #8cffe5 // #6DC066 // #80aebd // #8cffe5

// Basic Volume Calcs //
vol  =  volume
bull =  close>open?vol:0 
bear =  open>close?vol:0

// Double EMA Function //
dema(src, len) => (2 * ema(src, len) - ema(ema(src, len), len))

// BEAR Moving Average Calculation
bullma = maType == "Exponential" ?        ema(bull, length) :
         maType == "Double Exponential" ? dema(bull, length) :
         sma(bull, length)

// BEAR Moving Average Calculation //
bearma = maType == "Exponential" ?        ema(bear, length) :
         maType == "Double Exponential" ? dema(bear, length) :
         sma(bear, length)

// ma dif //
vf_dif = bullma-bearma
vf_absolute = vf_dif > 0 ? vf_dif : vf_dif * (-1)

// Volume Spikes //
gsig=crossover(bull, bullma*x)?vol:na
rsig=crossover(bear, bearma*x)?vol:na

// Color Calcs //
vdClr = vf_dif > 0 ? green : red
vClr=close>open?green:red

// Plots //
plot(vol, color=vClr, style=plot.style_columns, transp=80, title="Volume")
plot(bullma*2, color=green, linewidth=1, transp=0, title="Bull MA")
plot(bearma*2, color=red, linewidth=1, transp=0, title="Bear MA")

plot(gsig, style=plot.style_columns, transp=50, color=green, title="Bull Vol Spike")
plot(rsig, style=plot.style_columns, transp=50, color=red, title="Bear Vol Spike")

plot(vf_absolute/2.5, style=plot.style_area, color=vdClr, title="Difference Value")

if gsig
    strategy.entry("Enter Long", strategy.long)
else if rsig
    strategy.entry("Enter Short", strategy.short)

Related

More