
Overview
This strategy is a trend following and reversal trading system based on composite moving averages. It identifies trading opportunities by combining moving averages of different periods and monitoring price reactions to these averages. The core concept involves observing the relationship between price and moving averages, and trading based on price reactions at specific threshold levels.
Strategy Principle
The strategy employs various types of moving averages (EMA, TEMA, DEMA, WMA, SMA) and combines two different periods (default 20 and 30) through weighted or arithmetic averaging to construct a composite moving average. An uptrend is identified when price is above the average, and a downtrend when below. The strategy waits for price pullbacks near the moving average (controlled by a reaction percentage parameter) after a trend is established. Specifically, in an uptrend, it opens long positions when price pulls back below a specific percentage of the average and closes above it; in a downtrend, it opens short positions when price rebounds above a specific percentage and closes below the average.
Strategy Advantages
- The system demonstrates good adaptability, supporting multiple types of moving averages to suit different market characteristics.
- The composite moving average approach effectively reduces false signals that might occur with single-period averages.
- The inclusion of a reaction percentage concept avoids simple moving average crossover trades, improving trading reliability.
- Waiting for pullbacks in established trends allows for better entry prices.
Strategy Risks
- May generate frequent false signals in choppy markets, increasing trading costs.
- The lag inherent in composite moving averages can delay entry and exit timing.
- Fixed reaction percentages may need adjustment in different market environments.
- Significant drawdowns may occur during rapid trend transitions.
Strategy Optimization Directions
- Incorporate volatility indicators to dynamically adjust reaction percentages for better market adaptation.
- Add volume factors to confirm price reversal validity.
- Implement stop-loss and take-profit mechanisms for better risk control.
- Add trend strength evaluation for more aggressive parameter settings in strong trends.
- Consider market environment analysis for different parameter combinations in various market conditions.
Summary
This strategy combines trend following and reversal trading concepts, capturing opportunities through composite moving averages and price reaction mechanisms. Its core strengths lie in flexibility and false signal filtering capability, though parameter optimization across different market environments requires attention. With proper risk control and continuous improvement, the strategy shows potential for stable returns in practical trading.
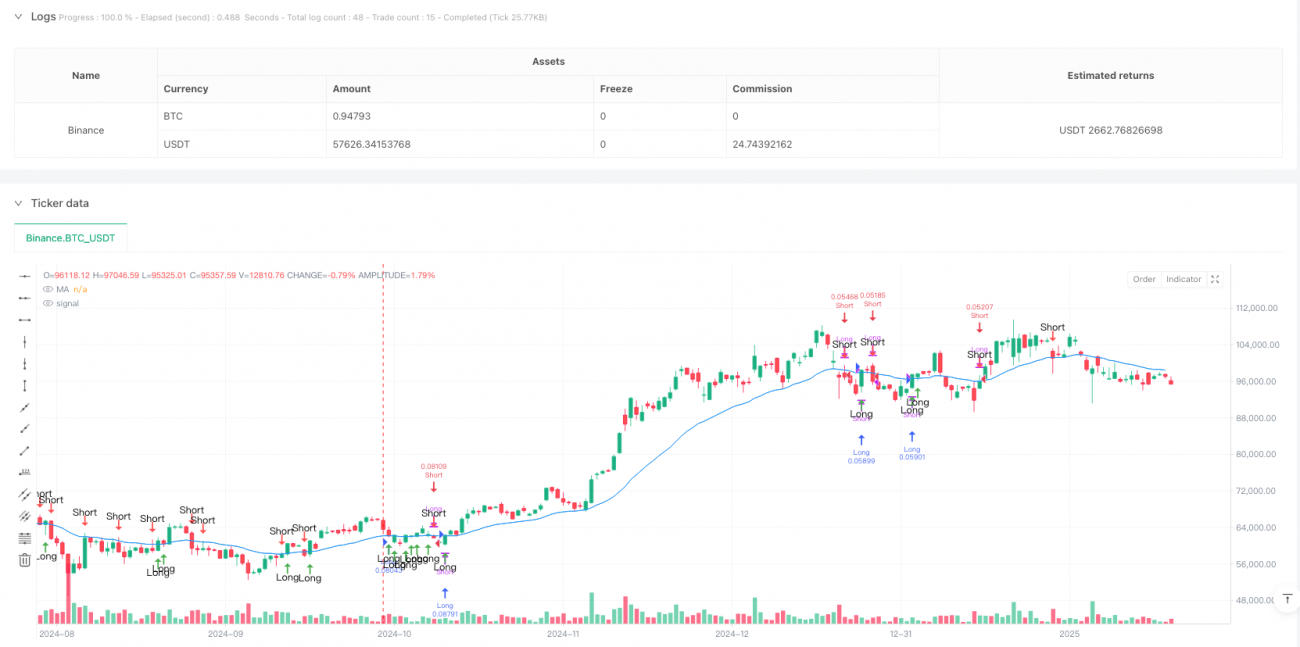
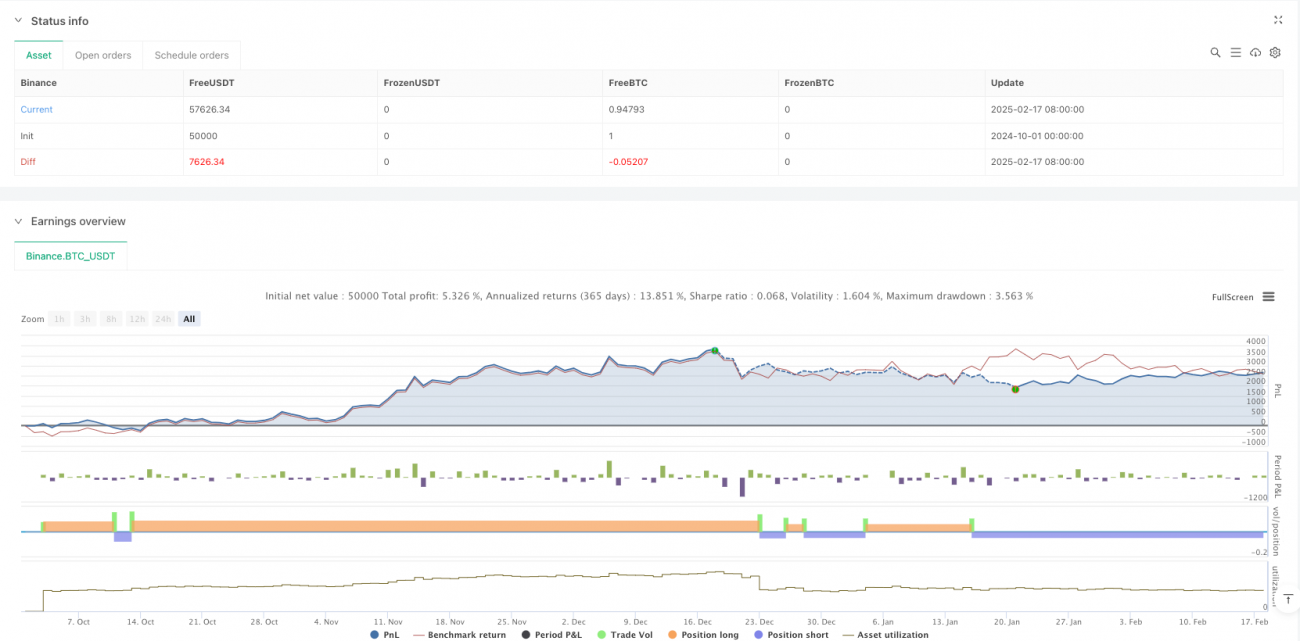
/*backtest
start: 2024-10-01 00:00:00
end: 2025-02-18 08:00:00
period: 1d
basePeriod: 1d
exchanges: [{"eid":"Binance","currency":"BTC_USDT"}]
*/

//@version=5
strategy("Ultrajante MA Reaction Strategy", overlay=true, initial_capital=10000,
     default_qty_type=strategy.percent_of_equity, default_qty_value=10)
- 1