Demark Setup Indicator

Author: ChaoZhang, Date: 2022-05-31 19:29:50
Tags: bullishbearish

The Setup Indicator was created by Tom Demark and this is one of many steps in his Sequential Indicator that I will be publishing at a later date. You guys all seemed to really like my Demark Reversal Points script and this indicator is very similar to that one. This indicator was designed for minor trend reversals and as you can see in my example chart, it gives many more buy and sell signals. Not all are perfect of course but it does a pretty good job in identifying minor price reversals overall. This indicator looks for downtrends or uptrends that exist for a certain amount of time to determine price reversal points.

If you like this one then let me know and I will continue publishing more Demark indicators or at least my versions of them. Let me know if there are any other indicators you would like to see me publish!

backtest

img


/*backtest
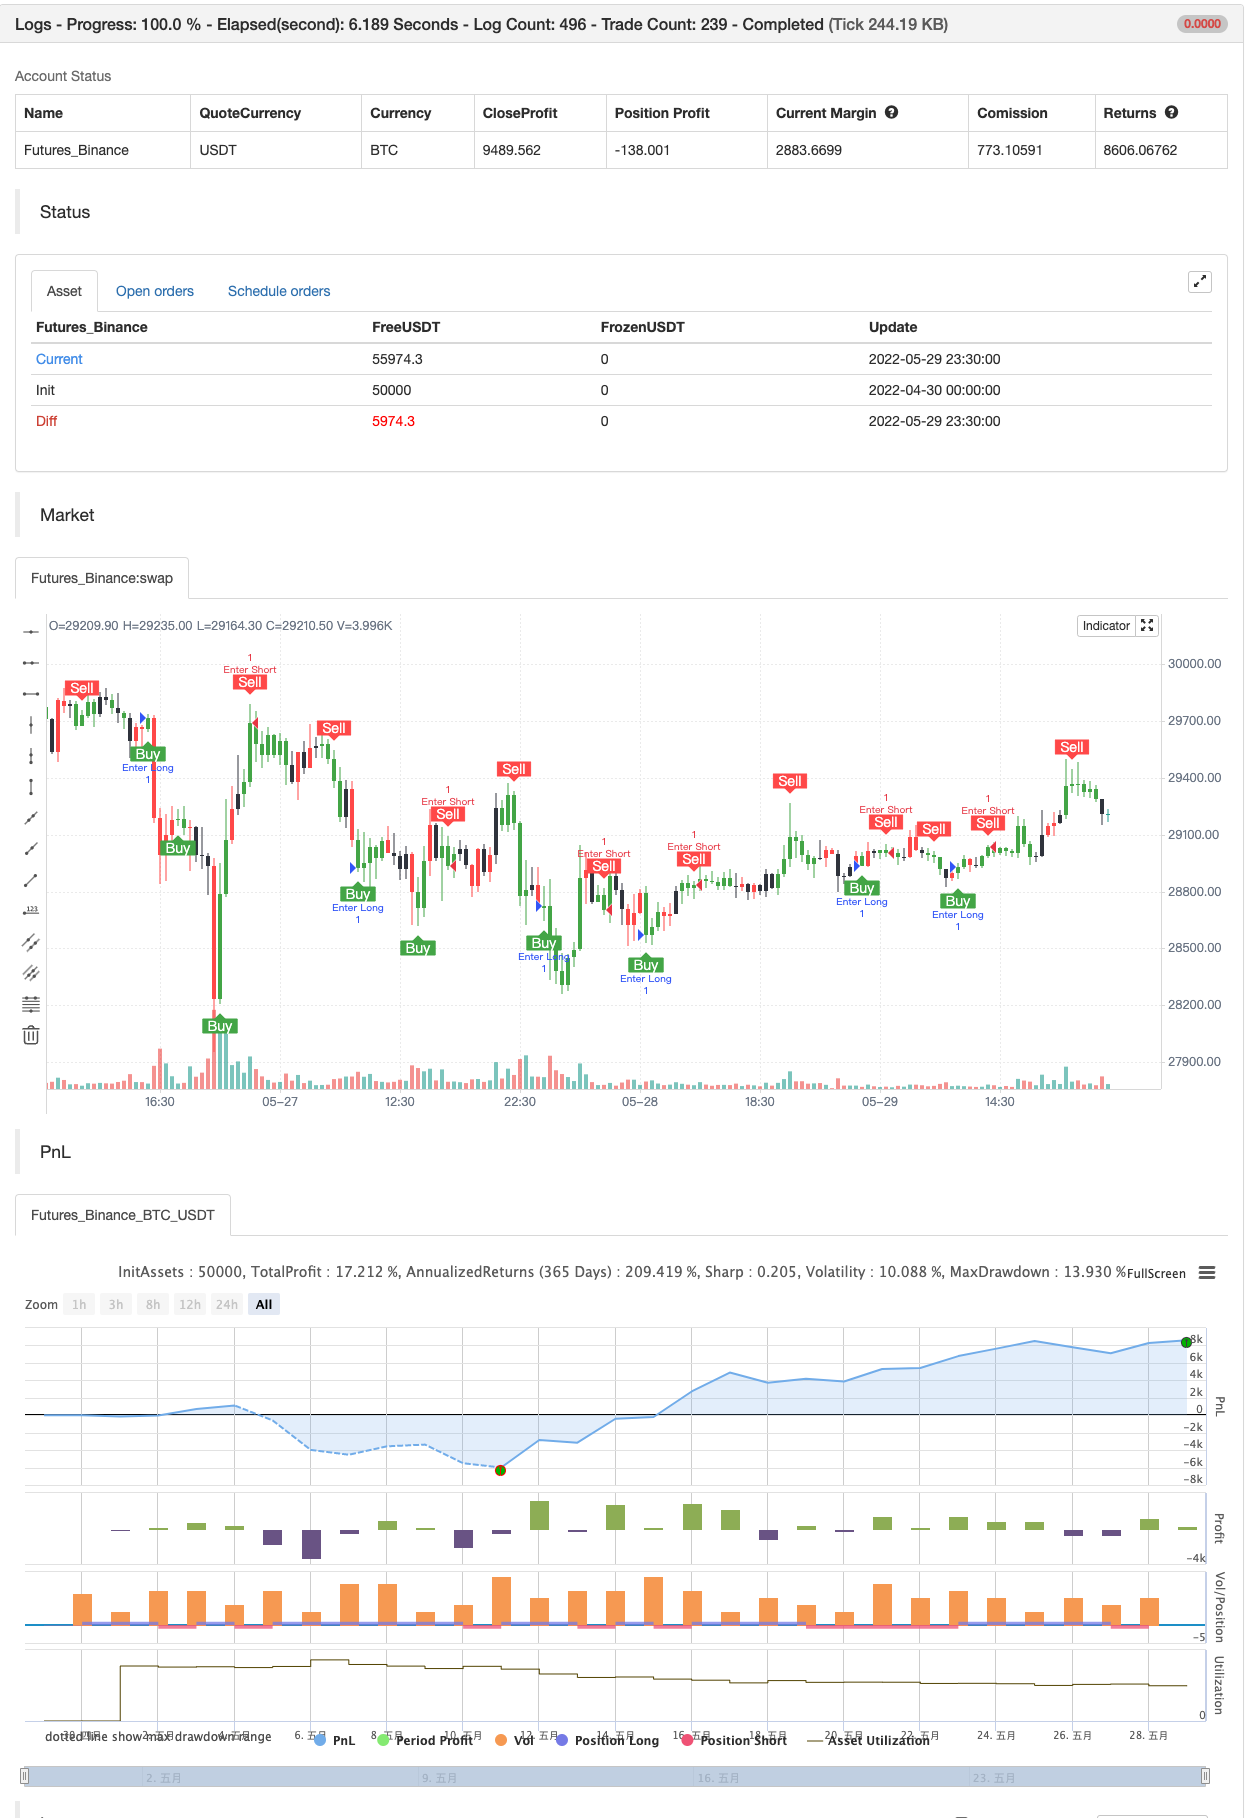
start: 2022-04-30 00:00:00
end: 2022-05-29 23:59:00
period: 30m
basePeriod: 15m
exchanges: [{"eid":"Futures_Binance","currency":"BTC_USDT"}]
*/

//@version=4
// Copyright (c) 2019-present, Franklin Moormann (cheatcountry)
// Demark Setup Indicator [CC] script may be freely distributed under the MIT license.
study("Demark Setup Indicator [CC]", overlay=true)

inp = input(title="Source", type=input.source, defval=close)
res = input(title="Resolution", type=input.resolution, defval="")
rep = input(title="Allow Repainting?", type=input.bool, defval=false)
bar = input(title="Allow Bar Color Change?", type=input.bool, defval=true)
src = security(syminfo.tickerid, res, inp[rep ? 0 : barstate.isrealtime ? 1 : 0])[rep ? 0 : barstate.isrealtime ? 0 : 1]
length = input(title="Length", type=input.integer, defval=4, minval=1)

uCount = 0, dCount = 0
for i = 0 to length - 1
    uCount := uCount + (nz(src[i]) > nz(src[i + length]) ? 1 : 0)
    dCount := dCount + (nz(src[i]) < nz(src[i + length]) ? 1 : 0)
    
dsi = dCount == length ? 1 : uCount == length ? -1 : 0

sig = dsi > 0 or uCount > dCount ? 1 : dsi < 0 or dCount > uCount ? -1 : 0
dsiColor = sig > 0 ? color.green : sig < 0 ? color.red : color.black
alertcondition(crossover(dsi, 0), "Buy Signal", "Bullish Change Detected")
alertcondition(crossunder(dsi, 0), "Sell Signal", "Bearish Change Detected")
barcolor(bar ? dsiColor : na)
plotshape(crossover(dsi, 0), "Buy", shape.labelup, location.belowbar, color.green, text="Buy", textcolor=color.white)
plotshape(crossunder(dsi, 0), "Sell", shape.labeldown, location.abovebar, color=color.red, text="Sell", textcolor=color.white)


if crossover(dsi, 0)
    strategy.entry("Enter Long", strategy.long)
else if crossunder(dsi, 0)
    strategy.entry("Enter Short", strategy.short)

Related

More