High-Frequency Reversal Trading Strategy Based on Momentum RSI Indicator

Overview
This strategy utilizes the RSI indicator to measure price momentum and determines entry timings by calculating the standard deviation of changes in RSI. It enters a long position when the RSI momentum exceeds the standard deviation threshold and is less than the previous momentum multiplied by an exhaustion factor, and enters a short position under the opposite conditions. The strategy uses limit orders for exit, controlling risk by setting profit target and stop loss ticks. The strategy executes on every price tick to capture all potential price movements.
Strategy Principle
- Calculate the RSI indicator to measure price momentum.
- Calculate the standard deviation of changes in RSI to determine entry thresholds.
- Calculate RSI momentum, which is the change in RSI.
- Enter a long position when the RSI momentum exceeds the standard deviation threshold and is less than the previous momentum multiplied by an exhaustion factor.
- Enter a short position when the RSI momentum is below the negative standard deviation threshold and is greater than the previous momentum multiplied by an exhaustion factor.
- Use limit orders for exit, setting profit target and stop loss ticks.
- The strategy executes on every price tick to capture all potential price movements.
Strategy Advantages
- High-frequency execution, able to capture more trading opportunities.
- Using RSI momentum and standard deviation thresholds, able to enter trades when the price trend is clear.
- Introducing an exhaustion factor to avoid entering trades during extreme conditions, reducing risk.
- Using limit orders for exit, able to better control risk.
- Programmatic trading with high execution efficiency, avoiding the interference of human emotions.
Strategy Risks
- High-frequency trading may lead to higher transaction costs.
- The RSI indicator may become dull, causing trading signals to fail.
- The settings of standard deviation threshold and exhaustion factor need to be optimized according to market conditions, otherwise it may lead to frequent trading or missed trading opportunities.
- Limit order exit may result in longer holding periods, taking on more risk.
- The strategy may perform poorly in extreme market conditions.
Strategy Optimization Directions
- Introduce more indicators, such as price action indicators, to improve the accuracy of trading signals.
- Optimize the settings of standard deviation threshold and exhaustion factor to adapt to different market conditions.
- Introduce position management, adjusting position size according to market volatility to control risk.
- Consider introducing trend filtering, trading when the trend is clear, and avoiding frequent trading in volatile markets.
- Optimize the settings of profit target and stop loss ticks to improve the strategy's profit-to-loss ratio.
Summary
This strategy utilizes RSI momentum and standard deviation thresholds to perform reversal trading in a high-frequency environment. By introducing an exhaustion factor and limit order exit, the strategy is able to capture trading opportunities brought by price movements while controlling risk. However, the strategy still needs further optimization in actual application, such as introducing more indicators, optimizing parameter settings, introducing position management and trend filtering, etc., to improve the stability and profitability of the strategy.
/*backtest
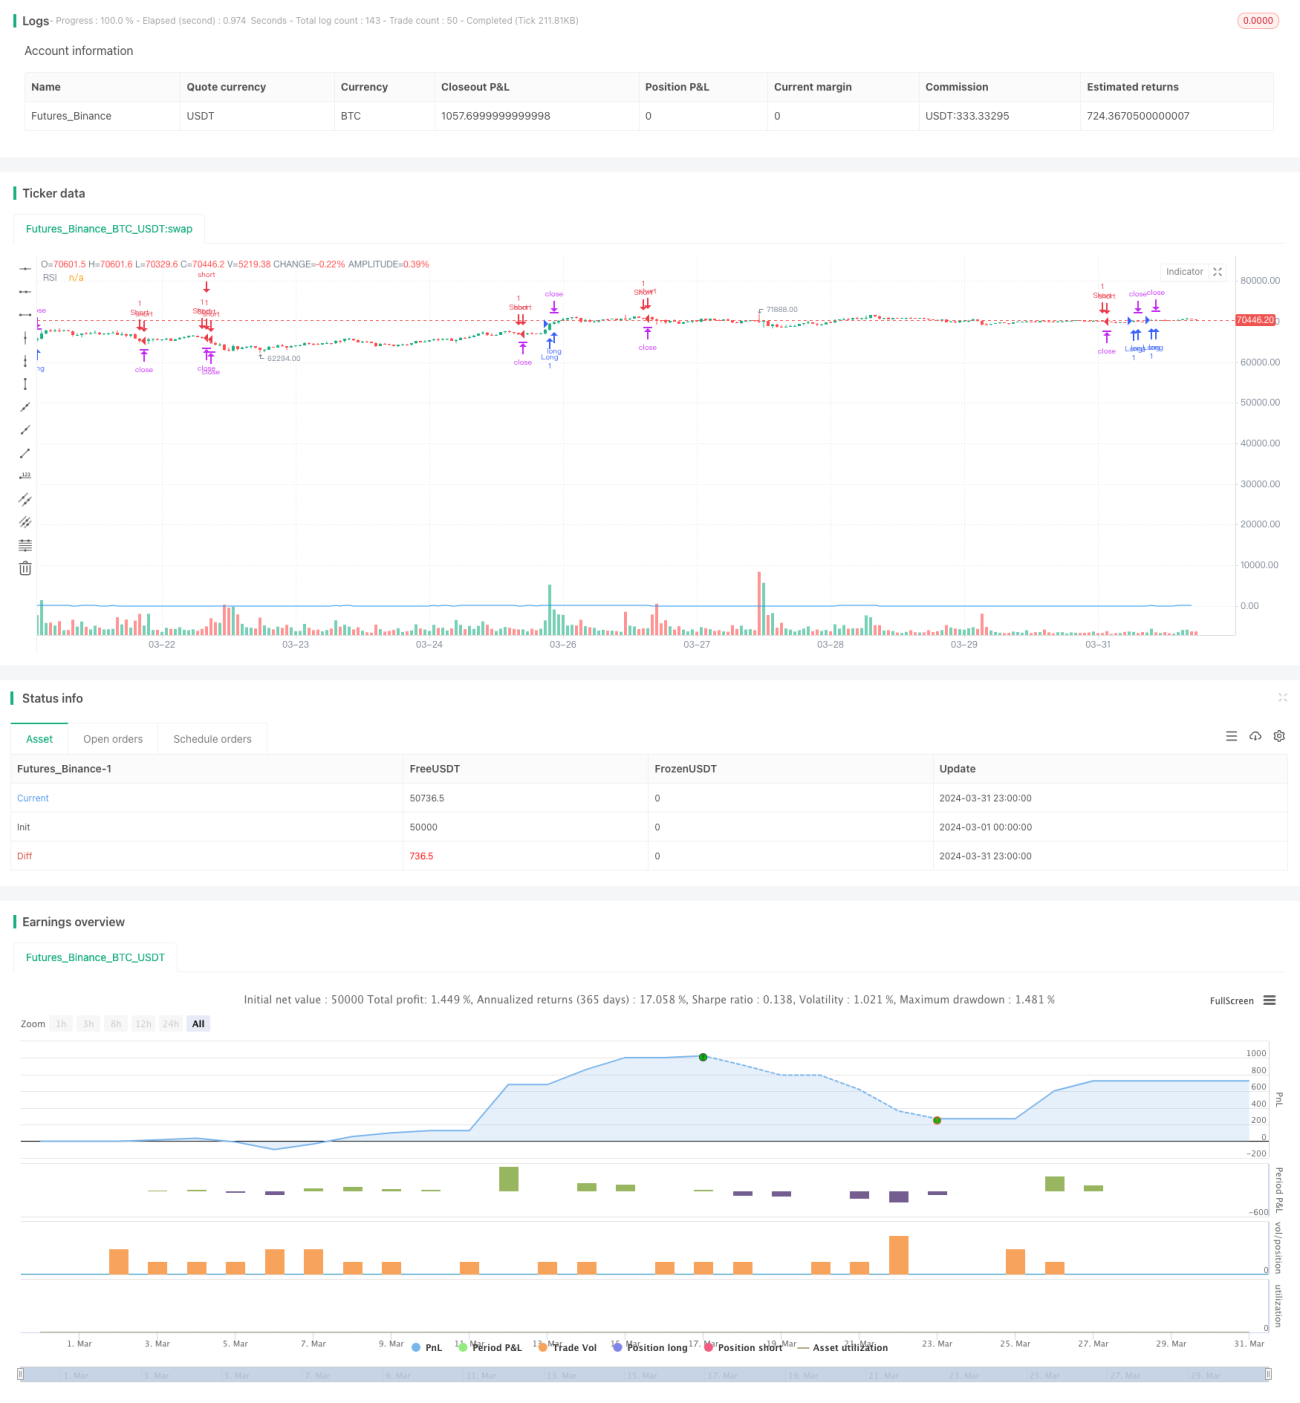
start: 2024-03-01 00:00:00
end: 2024-03-31 23:59:59
period: 1h
basePeriod: 15m
exchanges: [{"eid":"Futures_Binance","currency":"BTC_USDT"}]
*/
//@version=5
strategy("MCOTs Intuition Strategy", overlay=true, default_qty_type=strategy.fixed, default_qty_value=1, initial_capital=50000, calc_on_every_tick=true)
// Input for RSI period- 1