Dynamic MACD and Ichimoku Cloud Trading Strategy

Overview
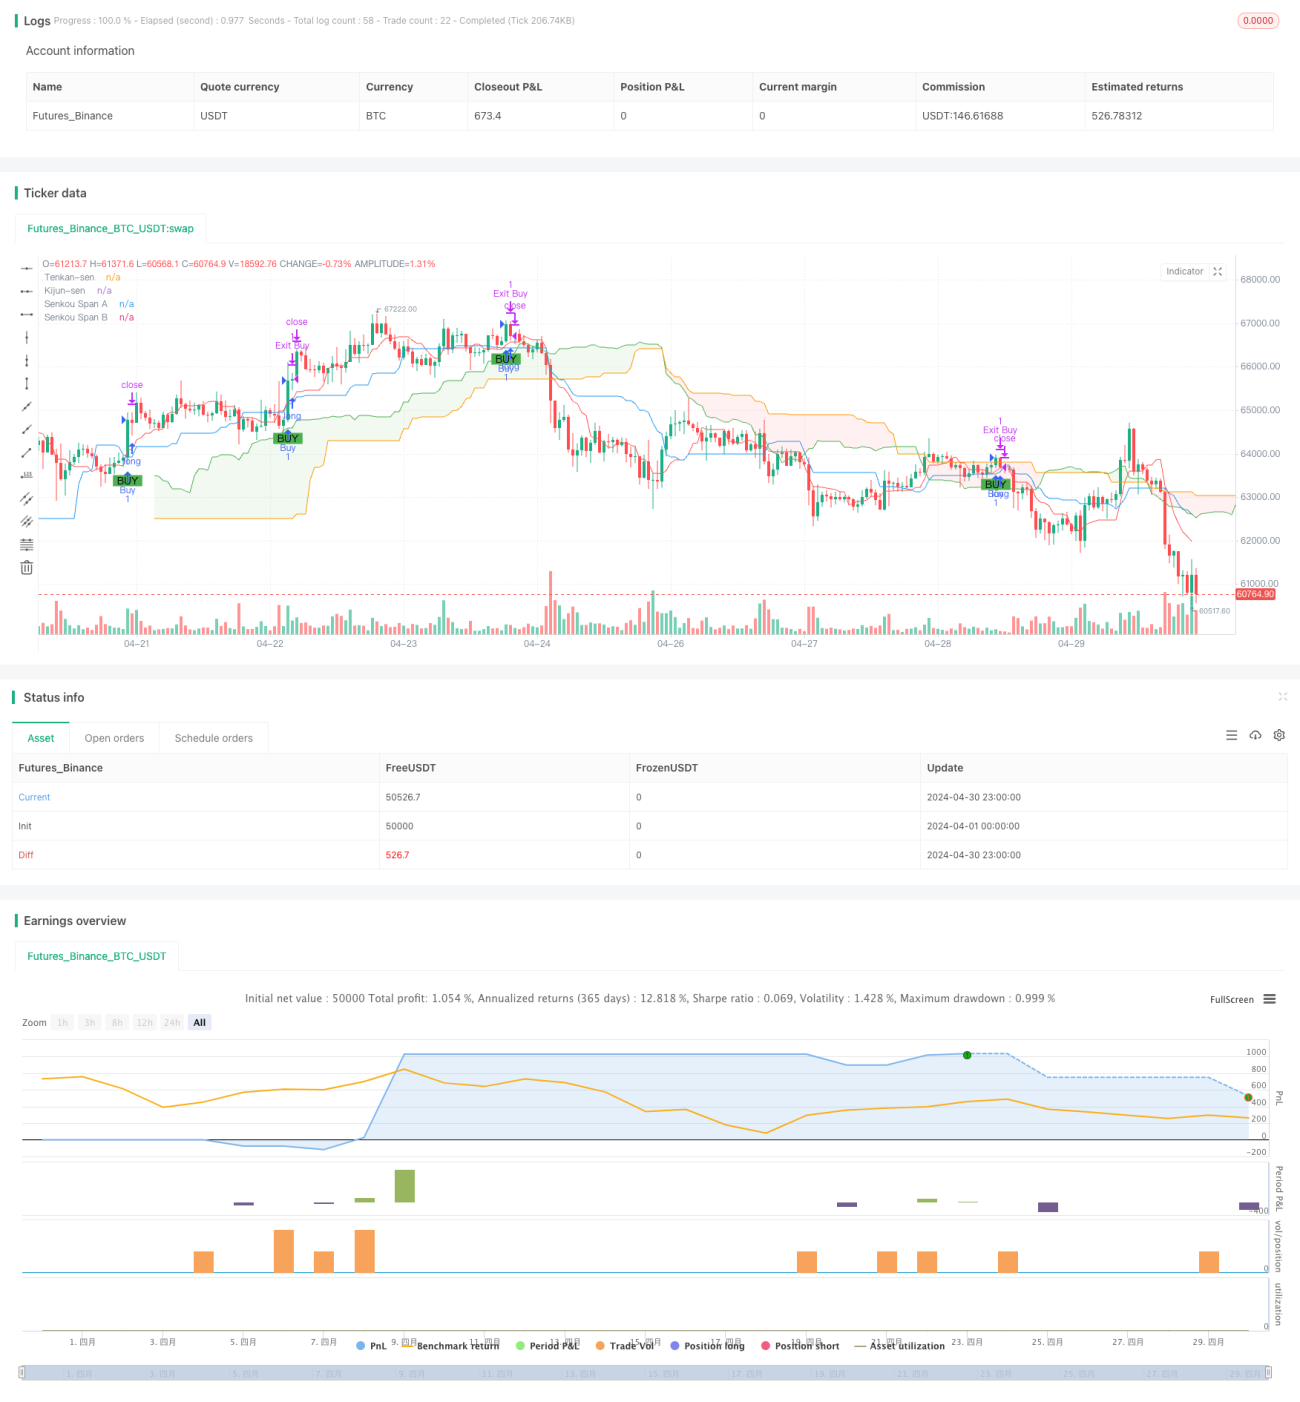
This trading strategy combines two technical indicators, MACD and Ichimoku Cloud, to capture medium-term trends and momentum shifts. The MACD indicator consists of fast, slow, and signal lines, using 12, 26, and 9 settings respectively, to identify momentum changes and trend reversals. The Ichimoku Cloud incorporates Tenkan-sen, Kijun-sen, Senkou Span A, and Senkou Span B, providing insights into trend strength, direction, and support/resistance levels. The strategy offers entry and exit signals based on clearly defined criteria for active traders, while considering risk management to protect each trade from undue risk and aim for substantial profits.
Strategy Principles
The strategy utilizes the MACD indicator and Ichimoku Cloud to generate buy and sell signals. A buy signal is triggered when the price exceeds the Ichimoku Cloud and the MACD line crosses above the signal line, indicating a bullish trend. A sell signal is activated when the price falls below the Ichimoku Cloud and the MACD line crosses below the signal line, signaling a bearish trend. Stop loss and take profit levels are configurable based on volatility and historical price action, but initially set with a focus on risk management to preserve capital and lock in profits.
Strategy Advantages
- Combines two powerful technical indicators, MACD and Ichimoku Cloud, for more comprehensive and reliable trading signals.
- Suitable for medium-term trading, capturing trends and momentum changes.
- Clearly defined buy and sell criteria, easy to understand and execute.
- Incorporates risk management guidelines, protecting capital through stop loss and take profit settings.
- Encourages optimization and customization based on individual trading styles and stock characteristics.
Strategy Risks
- MACD and Ichimoku parameters may not be optimal for all market conditions and stocks.
- Frequent trading signals in volatile markets may lead to overtrading and commission losses.
- Improperly set stop loss levels may result in premature exits or excessive risk exposure.
- The strategy relies on historical data and may not accurately predict future price movements.
Strategy Optimization Directions
- Adjust MACD and Ichimoku parameters based on different stocks and market conditions.
- Introduce additional technical indicators, such as Relative Strength Index (RSI) or Average True Range (ATR), to improve signal quality.
- Optimize stop loss and take profit levels for better risk management and profit maximization.
- Consider market sentiment and fundamental factors to complement technical analysis.
Summary
The Dynamic MACD and Ichimoku Cloud Trading Strategy offers a powerful approach that combines two popular technical indicators to identify medium-term trends and momentum shifts. With clearly defined buy and sell criteria, as well as risk management guidelines, the strategy aims to help traders make informed decisions, control risk, and maximize profits. However, traders should optimize and customize the strategy based on their own trading styles and market characteristics, and continuously monitor its performance. With proper adjustments and risk management, this strategy can be a valuable addition to a trader's toolkit.
- 1