
概述
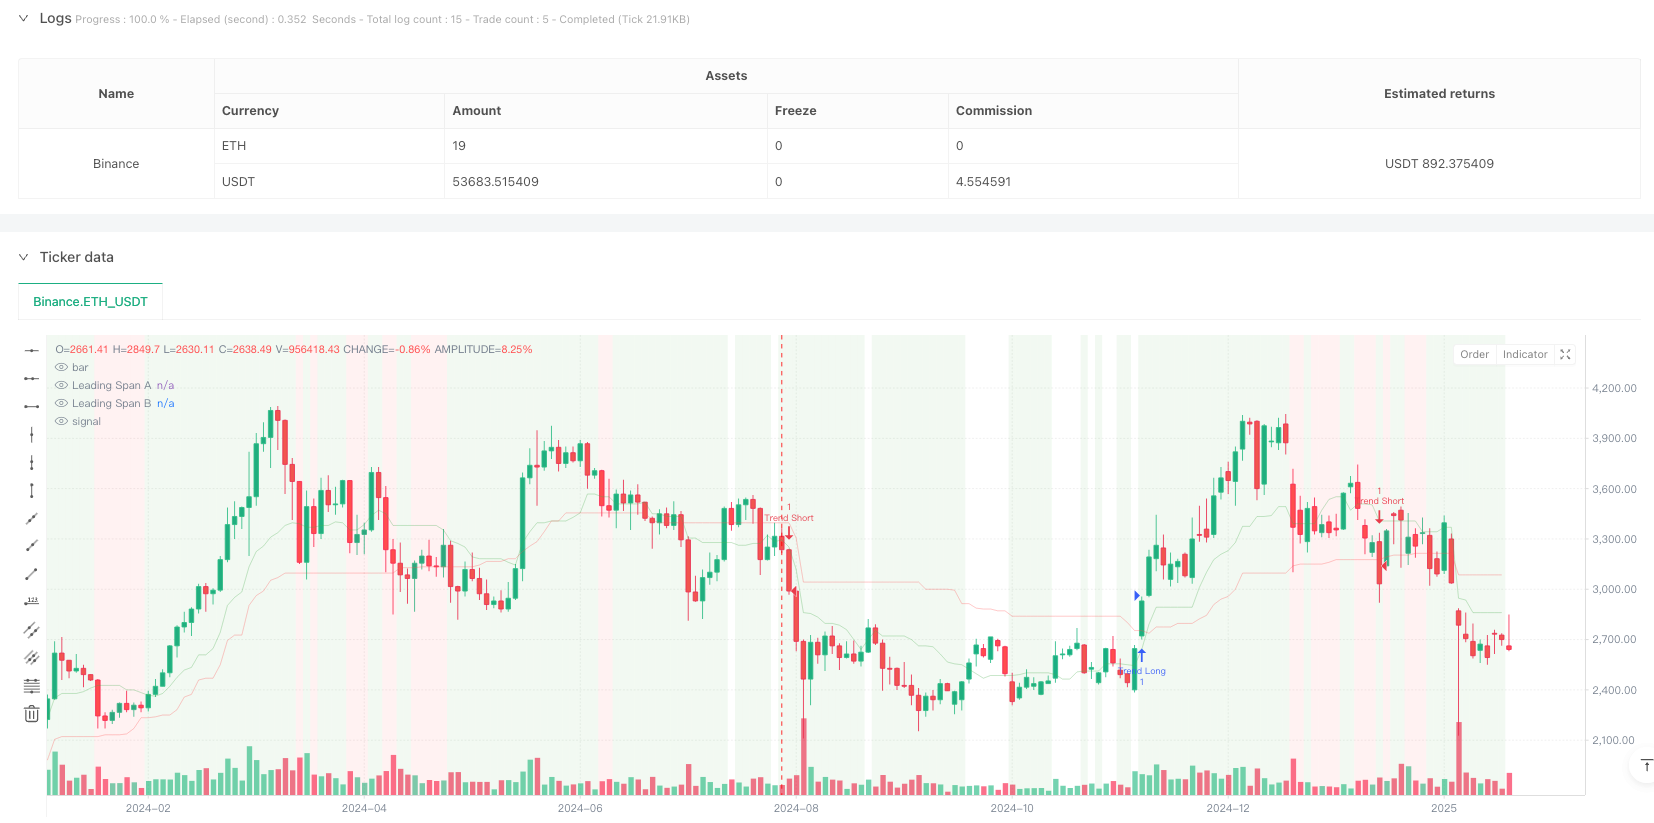
本策略是一个结合了趋势跟踪和区间交易的复合型交易系统,通过ichimoku云图进行市场状态识别,结合MACD动量确认和RSI超买超卖指标,同时运用ATR进行动态止损管理。该策略能够在趋势市场中捕捉趋势性机会,在震荡市场中寻找反转机会,具有较强的适应性和灵活性。
策略原理
策略采用多层次信号确认机制: 1. 使用ichimoku云图作为市场状态的主要判断依据,通过价格与云层的位置关系判断市场是处于趋势还是震荡状态 2. 在趋势市场中,当价格位于云层之上且RSI>55、MACD柱状图为正时,进场做多;当价格位于云层之下且RSI<45、MACD柱状图为负时,进场做空 3. 在震荡市场中,当RSI<30且随机RSI<20时,寻找做多机会;当RSI>70且随机RSI>80时,寻找做空机会 4. 使用基于ATR的动态止损来管理风险,止损距离为ATR值的2倍
策略优势
- 市场适应性强:能够根据不同市场状态自动调整交易策略,提高策略的稳定性
- 信号可靠性高:采用多重指标验证机制,降低虚假信号的影响
- 风险控制完善:通过ATR动态止损,既能让盈利充分发展,又能有效控制风险
- 可视化效果好:通过背景颜色标注市场状态,便于交易者直观理解市场环境
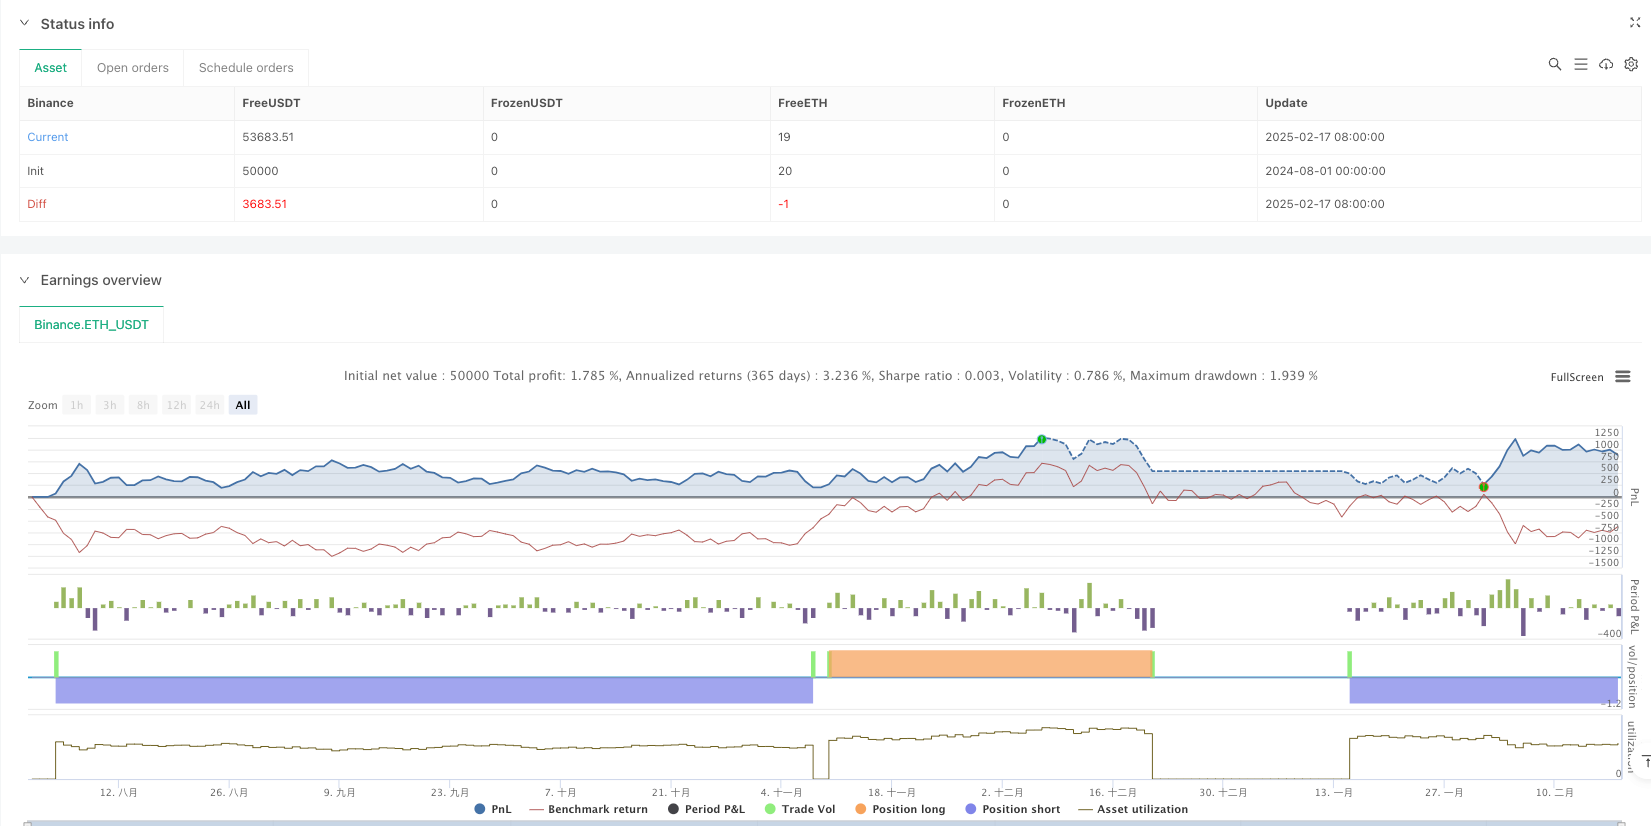
- 高时间周期表现优异:在日线周期上具有2.159的利润因子,净利润达到10.71%
策略风险
- 胜率偏低:各个时间周期的胜率都低于40%,需要较强的心理承受能力
- 低时间周期过度交易:在4小时周期内执行了430笔交易,效率较低
- 信号滞后性:由于使用多重指标验证,可能错过一些市场机会
- 参数优化难度大:多个指标的组合增加了策略优化的复杂度
策略优化方向
- 信号筛选优化:可以通过调整各指标的阈值来提高胜率
- 时间周期适配:建议主要在日线及以上周期使用,可以根据不同市场特点调整参数
- 止损优化:可以考虑根据不同市场状态动态调整ATR倍数
- 入场时机优化:可以增加成交量确认或价格形态确认来提高入场准确性
- 仓位管理优化:可以根据信号强度设计动态仓位管理系统
总结
该策略是一个设计合理、逻辑清晰的综合交易系统,通过多重指标的配合使用,实现了市场状态的智能识别和交易机会的精准捕捉。虽然在低时间周期上存在一些问题,但在日线等较高时间周期上表现优异。建议交易者在实盘使用时,着重关注日线级别的信号,并根据自身风险承受能力合理调整参数。通过不断优化和调整,该策略有望为交易者提供稳定的盈利机会。
策略源码
/*backtest
start: 2024-08-01 00:00:00
end: 2025-02-18 08:00:00
period: 2d
basePeriod: 2d
exchanges: [{"eid":"Binance","currency":"ETH_USDT"}]
*/

// This Pine Script™ code is subject to the terms of the Mozilla Public License 2.0 at https://mozilla.org/MPL/2.0/
// © FIWB

//@version=6
strategy("Refined Ichimoku with MACD and RSI Strategy", overlay=true)

// Inputs for Ichimoku Cloud
conversionLength = input.int(9, title="Conversion Line Length", group="Ichimoku Settings")
baseLength = input.int(26, title="Base Line Length", group="Ichimoku Settings")
laggingSpanLength = input.int(52, title="Lagging Span Length", group="Ichimoku Settings")
displacement = input.int(26, title="Displacement", group="Ichimoku Settings")

// Inputs for MACD
macdFastLength = input.int(12, title="MACD Fast Length", group="MACD Settings")
macdSlowLength = input.int(26, title="MACD Slow Length", group="MACD Settings")
macdSignalLength = input.int(9, title="MACD Signal Length", group="MACD Settings")

// Inputs for RSI/Stochastic RSI
rsiLength = input.int(14, title="RSI Length", group="Momentum Indicators")
stochRsiLength = input.int(14, title="Stochastic RSI Length", group="Momentum Indicators")
stochRsiK = input.int(3, title="%K Smoothing", group="Momentum Indicators")
stochRsiD = input.int(3, title="%D Smoothing", group="Momentum Indicators")

// Inputs for ATR
atrLength = input.int(14, title="ATR Length", group="Risk Management")
atrMultiplier = input.float(2.0, title="ATR Multiplier", group="Risk Management")

// Ichimoku Cloud Calculation
conversionLine = (ta.highest(high, conversionLength) + ta.lowest(low, conversionLength)) / 2
baseLine = (ta.highest(high, baseLength) + ta.lowest(low, baseLength)) / 2
leadingSpanA = (conversionLine + baseLine) / 2
leadingSpanB = (ta.highest(high, laggingSpanLength) + ta.lowest(low, laggingSpanLength)) / 2

// Market Regime Detection Using Ichimoku Cloud
priceAboveCloud = close >= leadingSpanA and close >= leadingSpanB
priceBelowCloud = close <= leadingSpanA and close <= leadingSpanB
priceNearCloud = close > leadingSpanB and close < leadingSpanA

trendingMarket = priceAboveCloud or priceBelowCloud
rangeBoundMarket = priceNearCloud

// MACD Calculation
macdLine = ta.ema(close, macdFastLength) - ta.ema(close, macdSlowLength)
macdSignalLine = ta.sma(macdLine, macdSignalLength)
macdHistogram = macdLine - macdSignalLine

// RSI Calculation
rsiValue = ta.rsi(close, rsiLength)

// Stochastic RSI Calculation
stochRsiKValue = ta.sma(ta.stoch(close, high, low, stochRsiLength), stochRsiK)
stochRsiDValue = ta.sma(stochRsiKValue, stochRsiD)

// Entry Conditions with Tightened Filters
trendLongCondition = trendingMarket and priceAboveCloud and rsiValue > 55 and macdHistogram > 0 and stochRsiKValue > stochRsiDValue
trendShortCondition = trendingMarket and priceBelowCloud and rsiValue < 45 and macdHistogram < 0 and stochRsiKValue < stochRsiDValue

rangeLongCondition = rangeBoundMarket and rsiValue < 30 and stochRsiKValue < 20
rangeShortCondition = rangeBoundMarket and rsiValue > 70 and stochRsiKValue > 80

// Risk Management: Stop-Loss Based on ATR
atrValue = ta.atr(atrLength)
longStopLoss = low - atrMultiplier * atrValue
shortStopLoss = high + atrMultiplier * atrValue

// Strategy Execution: Entries and Exits
if trendLongCondition
    strategy.entry("Trend Long", strategy.long)
    strategy.exit("Exit Trend Long", from_entry="Trend Long", stop=longStopLoss)

if trendShortCondition
    strategy.entry("Trend Short", strategy.short)
    strategy.exit("Exit Trend Short", from_entry="Trend Short", stop=shortStopLoss)

if rangeLongCondition
    strategy.entry("Range Long", strategy.long)
    strategy.exit("Exit Range Long", from_entry="Range Long", stop=longStopLoss)

if rangeShortCondition
    strategy.entry("Range Short", strategy.short)
    strategy.exit("Exit Range Short", from_entry="Range Short", stop=shortStopLoss)

// Visualization: Highlight Market Regimes on Chart Background
bgcolor(trendingMarket ? color.new(color.green, 90) : na)
bgcolor(rangeBoundMarket ? color.new(color.red, 90) : na)

// Plot Ichimoku Cloud for Visualization
plot(leadingSpanA, color=color.new(color.green, 80), title="Leading Span A")
plot(leadingSpanB, color=color.new(color.red, 80), title="Leading Span B")
相关推荐