概述
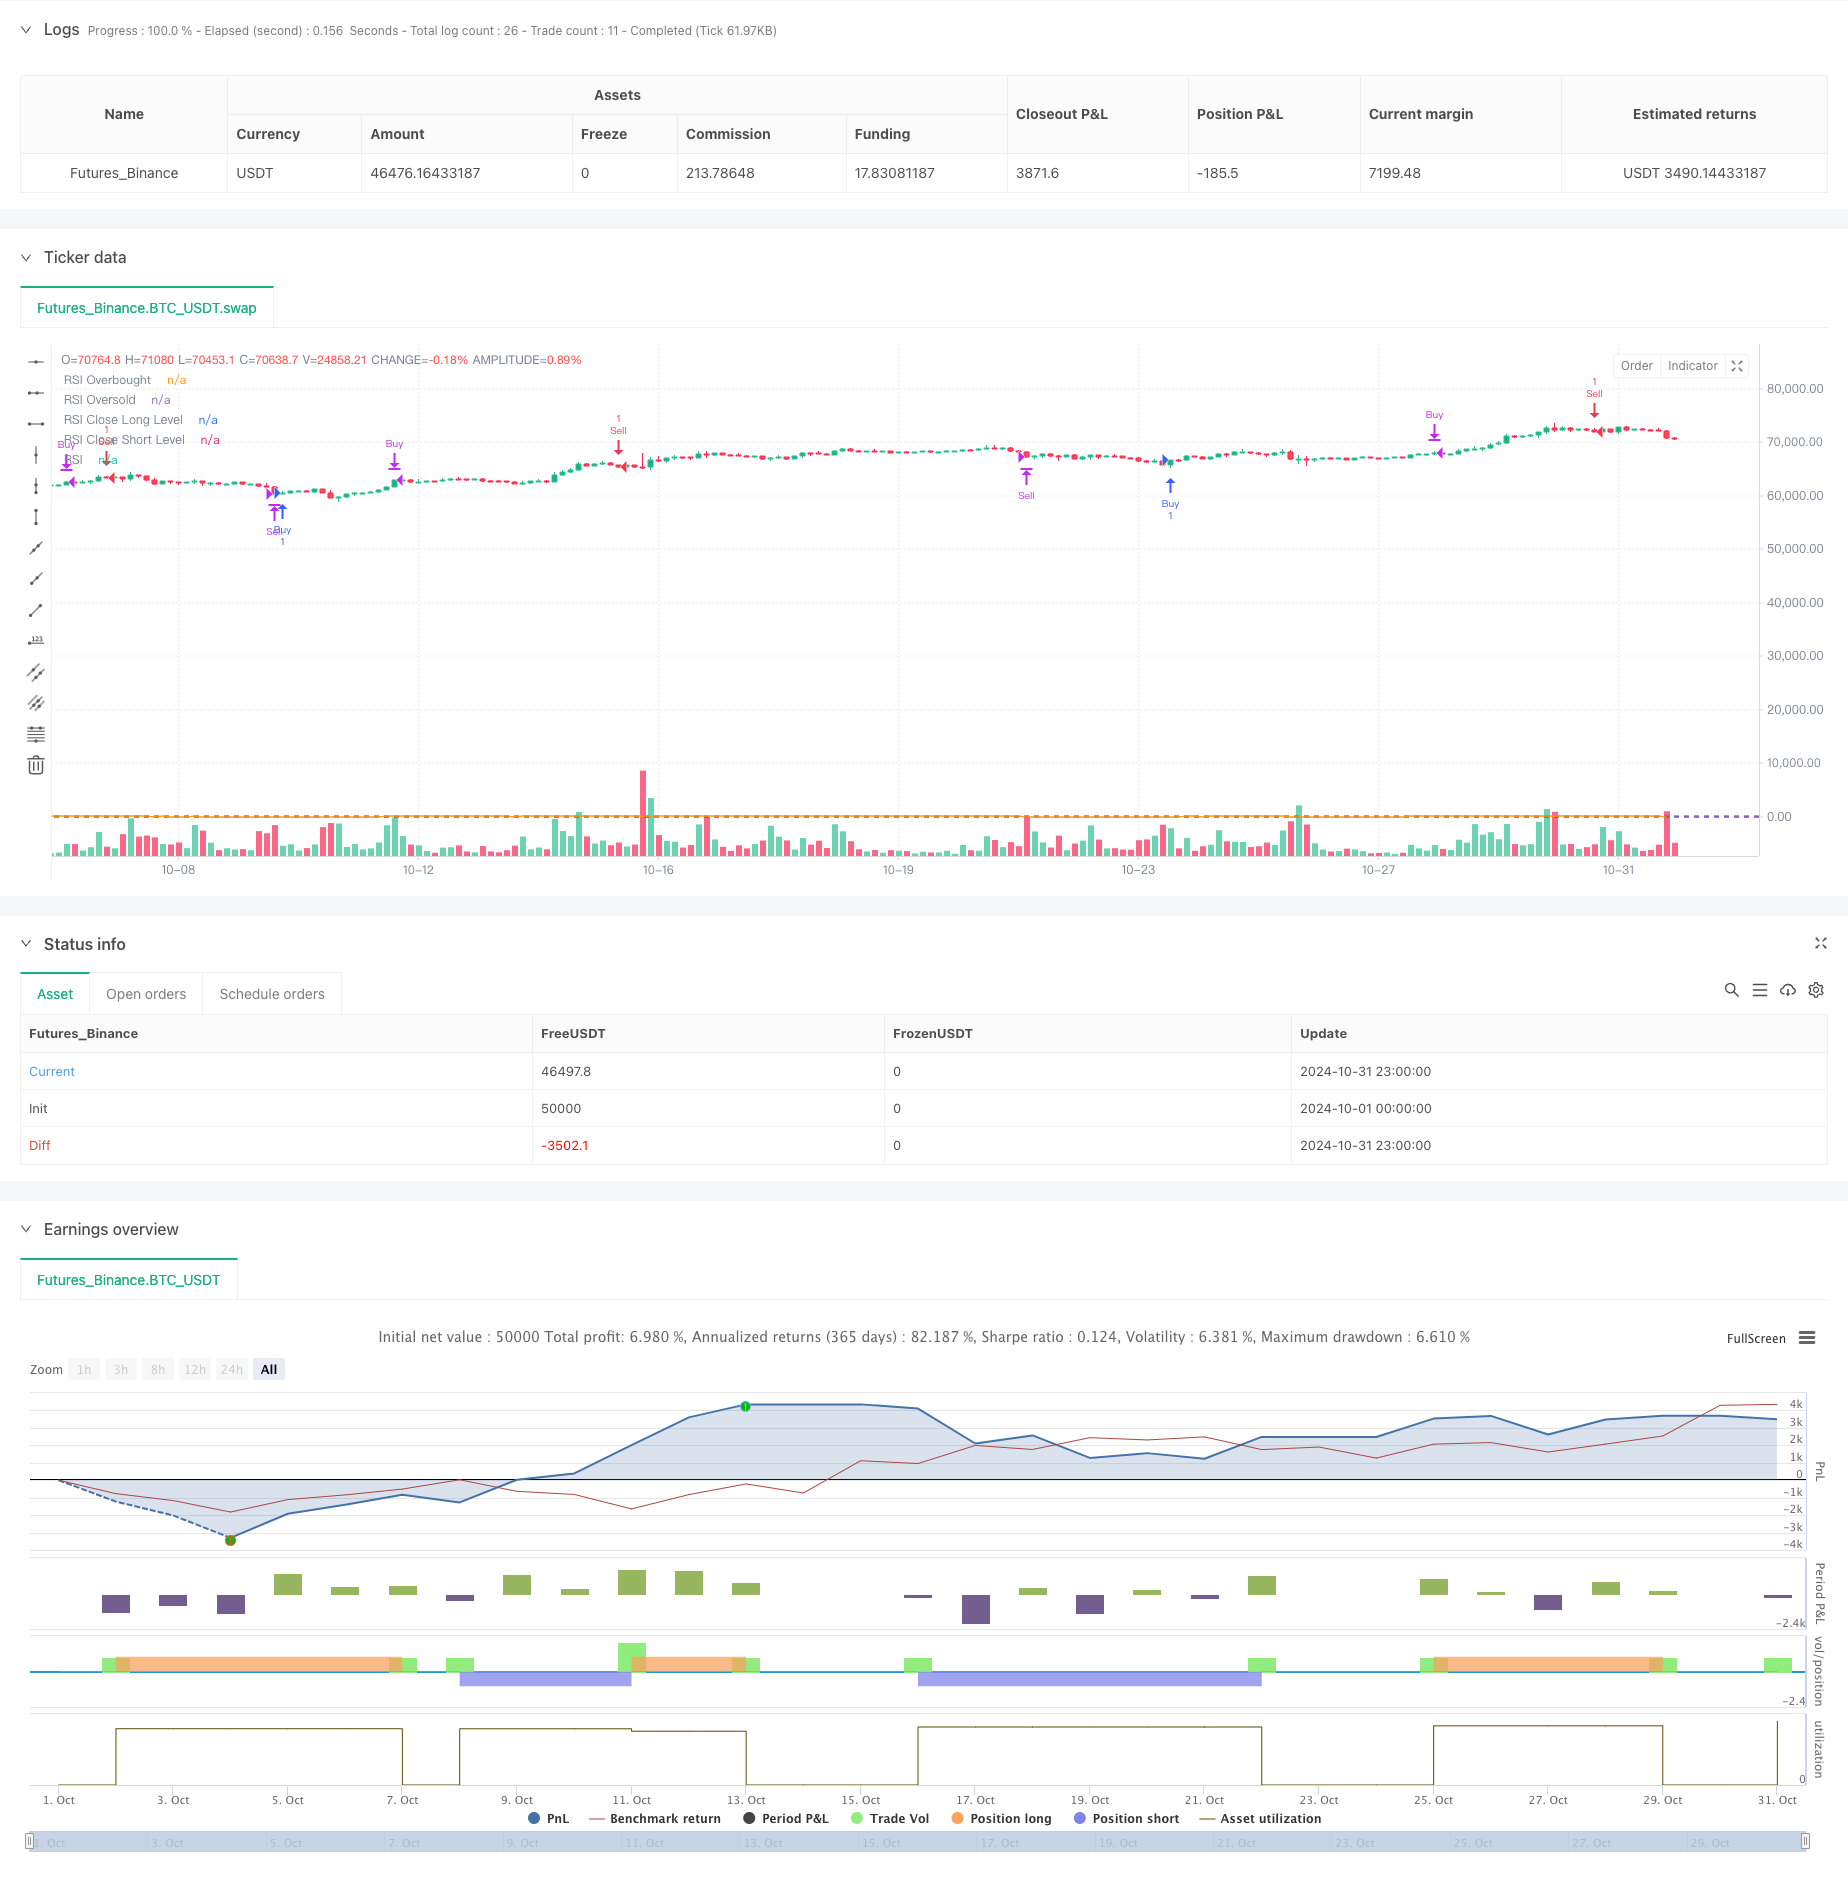
本策略是一个基于相对强弱指数(RSI)的动态平仓策略,通过设置动态的开仓和平仓条件来捕捉市场趋势。策略在RSI指标突破超买超卖水平时产生交易信号,同时引入了独特的动态平仓机制,通过在不同RSI水平设置平仓条件来优化交易表现。该策略采用完整的多空交易系统,能够在市场双向波动中捕捉交易机会。
策略原理
策略的核心逻辑包含以下几个关键组成部分: 1. 信号生成机制:使用RSI指标的超买超卖水平(70⁄30)作为主要交易信号。当RSI向上突破30时产生买入信号,向下突破70时产生卖出信号。 2. 仓位管理系统:策略采用单一持仓原则,确保在任何时刻最多只持有一个方向的仓位,有效控制风险敞口。 3. 动态平仓机制:设置了差异化的RSI平仓水平(多仓60/空仓40),这种非对称设计能更好地适应市场趋势特征。 4. 可视化模块:通过在图表上绘制RSI线、超买超卖水平以及平仓水平,帮助交易者直观理解市场状态。
策略优势
- 系统化交易:策略完全系统化,消除了主观判断带来的情绪干扰。
- 风险控制:通过单一持仓原则和动态平仓机制,有效控制风险。
- 适应性强:可以根据不同市场特征调整RSI参数和平仓水平。
- 双向交易:能够在上涨和下跌市场中均获得交易机会。
- 可视化支持:直观的图表展示有助于理解市场状态和策略逻辑。
策略风险
- 震荡市场风险:在横盘震荡市场中可能频繁交易,增加交易成本。
- 趋势延续风险:提前平仓可能错过更大的趋势机会。
- 参数敏感性:策略表现对RSI参数和平仓水平的设置较为敏感。
- 滑点影响:在市场剧烈波动时可能面临较大滑点风险。
策略优化方向
- 引入趋势过滤器:可以添加移动平均线等趋势指标,过滤假信号。
- 动态参数优化:根据市场波动率自动调整RSI参数和平仓水平。
- 增加仓位管理:引入资金管理模块,根据市场风险度调整持仓规模。
- 优化平仓机制:考虑添加追踪止损功能,更好地保护盈利。
总结
这是一个设计合理的动量交易策略,通过RSI指标和动态平仓机制捕捉市场机会。策略的主要特点是系统化程度高、风险控制完善、适应性强。虽然存在一些固有风险,但通过参数优化和功能扩展,策略仍有较大的改进空间。对于寻求稳健交易系统的投资者来说,这是一个值得考虑的策略框架。
策略源码
/*backtest
start: 2024-10-01 00:00:00
end: 2024-10-31 23:59:59
period: 3h
basePeriod: 3h
exchanges: [{"eid":"Futures_Binance","currency":"BTC_USDT"}]
*/

//@version=5
strategy("RSI Strategy with Close Levels", shorttitle="RSI Strat", overlay=true)

// RSI Input settings
rsiLength = input.int(14, title="RSI Length")
rsiOverbought = input.int(70, title="RSI Overbought Level")
rsiOversold = input.int(30, title="RSI Oversold Level")
rsiCloseLongLevel = input.int(60, title="RSI Level to Close Long Position")
rsiCloseShortLevel = input.int(40, title="RSI Level to Close Short Position")

// Calculate RSI
rsi = ta.rsi(close, rsiLength)

// Generate buy and sell signals based on RSI levels
buySignal = ta.crossover(rsi, rsiOversold)
sellSignal = ta.crossunder(rsi, rsiOverbought)

// Check if there are open positions
var bool inPosition = na
if (strategy.opentrades > 0)
    inPosition := true
else
    inPosition := false

// Open long position on buy signal if not already in a position
if (buySignal and not inPosition)
    strategy.entry("Buy", strategy.long)
    inPosition := true

// Close long position on sell signal or when RSI reaches the close long level
if (inPosition and strategy.position_size > 0 and (sellSignal or rsi >= rsiCloseLongLevel))
    strategy.close("Buy")
    inPosition := false

// Open short position on sell signal if not already in a position
if (sellSignal and not inPosition)
    strategy.entry("Sell", strategy.short)
    inPosition := true

// Close short position on buy signal or when RSI reaches the close short level
if (inPosition and strategy.position_size < 0 and (buySignal or rsi <= rsiCloseShortLevel))
    strategy.close("Sell")
    inPosition := false

// Plot buy and sell signals
//plotshape(series=buySignal, title="Buy Signal", location=location.belowbar, color=color.green, style=shape.labelup, text="BUY")
//plotshape(series=sellSignal, title="Sell Signal", location=location.abovebar, color=color.red, style=shape.labeldown, text="SELL")

// Plot RSI for visualization
hline(rsiOverbought, "RSI Overbought", color=color.red)
hline(rsiOversold, "RSI Oversold", color=color.green)
hline(rsiCloseLongLevel, "RSI Close Long Level", color=color.blue)
hline(rsiCloseShortLevel, "RSI Close Short Level", color=color.purple)
plot(rsi, title="RSI", color=color.orange)
相关推荐