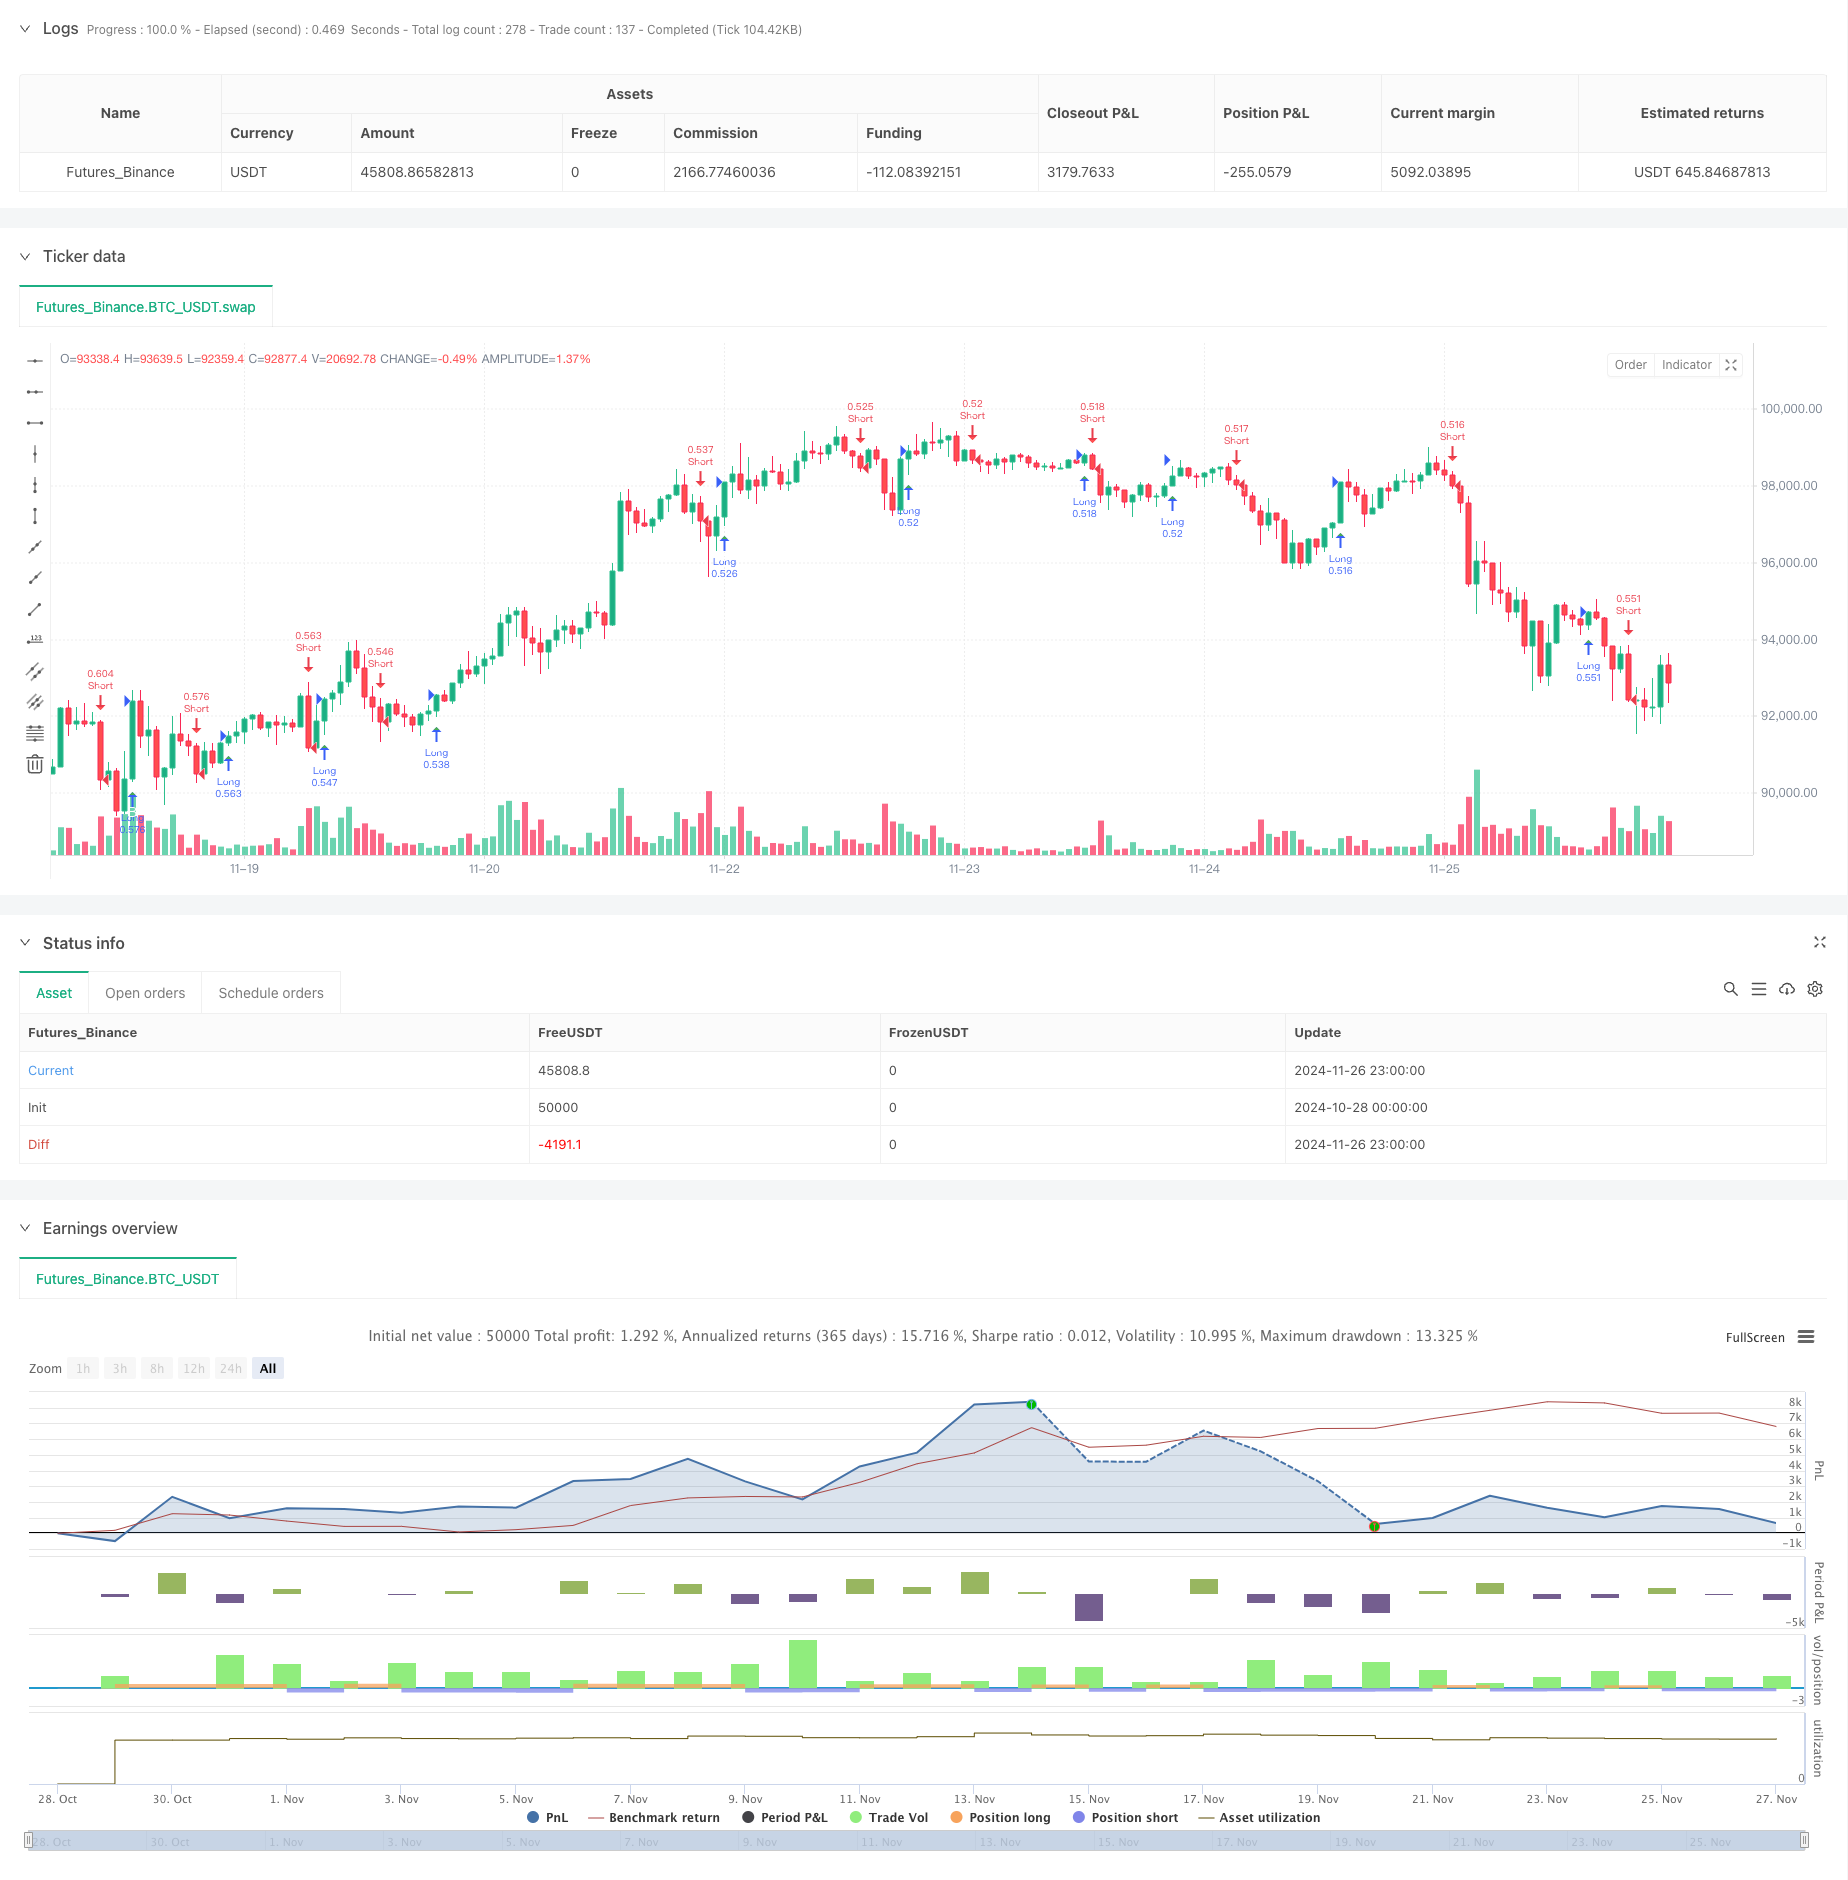
概述
这是一个基于波动率和Williams Percent Range(威廉指标)相结合的自适应趋势跟踪策略。该策略通过计算价格波动范围和自定义的计数器来调整趋势判断的敏感度,从而在不同市场环境下实现更好的适应性。策略的核心是通过观察价格波动的幅度来动态调整威廉指标的参数,从而更准确地捕捉市场趋势的转换点。
策略原理
策略首先计算一个周期内的价格波动范围(Range)和其移动平均值(AvgRange)。通过比较实时价格变化与平均波动范围的关系,建立两个计数器(TrueCount和TrueCount2)来记录显著波动的发生频率。这些计数器用于动态调整威廉指标的计算参数,使策略能够根据市场波动状态自动调整其敏感度。当调整后的威廉指标数值突破预设的上下阈值时,策略将产生相应的买入或卖出信号。
策略优势
- 自适应性强 - 通过波动率自适应机制,策略能够在不同市场环境下保持稳定表现
- 风险控制完善 - 内置风险参数RISK允许交易者根据自身风险偏好调整策略激进度
- 信号明确 - 使用清晰的突破信号机制,避免假信号
- 可扩展性好 - 策略框架允许引入其他技术指标进行优化
- 计算效率高 - 使用简单高效的计算方法,适合实时交易
策略风险
- 参数敏感性 - ASClength和RISK参数的选择会显著影响策略表现
- 市场环境依赖 - 在震荡市场中可能产生过多交易信号
- 滞后性 - 使用移动平均可能导致入场和出场存在一定延迟
- 虚假突破 - 在高波动期可能出现虚假信号 建议通过回测优化参数,并结合其他确认指标来降低风险。
策略优化方向
- 引入成交量指标 - 通过成交量确认趋势变化的有效性
- 优化计数器逻辑 - 可以考虑使用更复杂的统计方法来评估市场波动
- 添加止损机制 - 建议引入动态止损以更好地控制风险
- 市场环境过滤 - 增加市场环境判断模块,在不适合的市场条件下避免交易
- 参数自适应 - 开发参数自动优化机制,提高策略适应性
总结
这是一个结合了波动率分析和趋势跟踪的创新策略,通过自适应机制提高了策略的稳定性和可靠性。虽然存在一些固有风险,但通过合理的参数设置和优化方向的实施,该策略有望在各种市场环境下保持稳定的表现。策略的框架设计允许进一步扩展和优化,具有良好的发展潜力。
策略源码
/*backtest
start: 2024-10-28 00:00:00
end: 2024-11-27 00:00:00
period: 1h
basePeriod: 1h
exchanges: [{"eid":"Futures_Binance","currency":"BTC_USDT"}]
*/

//@version=5
strategy("ASCTrend", shorttitle="ASCTrend", overlay=true, default_qty_type=strategy.percent_of_equity, default_qty_value=100)

eternalfg = input(false, title="eternal 確定")
eternal = eternalfg ? 1 : 0
ASClength = input.int(title="ASC Length", minval=4, defval=10)
RISK = input.int(title="RISK", minval=0, defval=3)

// Custom sum function
customSum(source, length) =>
    sum = 0.0
    for i = 0 to length - 1
        sum := sum + source[i]
    sum

x1 = 67 + RISK
x2 = 33 - RISK
Range = ta.highest(ASClength) - ta.lowest(ASClength)
AvgRange = ta.sma(Range, ASClength)
CountFg = math.abs(open - close) >= AvgRange * 2.0 ? 1 : 0
TrueCount = customSum(CountFg, ASClength)
CountFg2 = math.abs(close[3] - close) >= AvgRange * 4.6 ? 1 : 0
TrueCount2 = customSum(CountFg2, ASClength - 3)
wpr3RR = ta.wpr(3 + RISK + RISK)
wpr3 = ta.wpr(3)
wpr4 = ta.wpr(4)
WprAbs = 100 + (TrueCount2 > 0 ? wpr4 : TrueCount > 0 ? wpr3 : wpr3RR)
ASC_Trend = 0
ASC_Trend := WprAbs[eternal] < x2[eternal] ? -1 : WprAbs[eternal] > x1[eternal] ? 1 : ASC_Trend[1]

if (ta.crossover(ASC_Trend, 0))
    strategy.entry("Long", strategy.long)

if (ta.crossunder(ASC_Trend, 0))
    strategy.entry("Short", strategy.short)

plotshape(ta.crossover(ASC_Trend, 0), location=location.belowbar, color=color.green, style=shape.triangleup, size=size.small, text="B", textcolor=color.white)
plotshape(ta.crossunder(ASC_Trend, 0), location=location.abovebar, color=color.red, style=shape.triangledown, size=size.small, text="S", textcolor=color.white)

alertcondition(ta.crossover(ASC_Trend, 0), title="ASC_Trend UP", message="ASC_Trend UP")
alertcondition(ta.crossunder(ASC_Trend, 0), title="ASC_Trend Down", message="ASC_Trend Down")
相关推荐