
Overview
This strategy is a 4-hour timeframe quantitative trading system based on Bollinger Bands, combining trend breakout and mean reversion trading concepts. The strategy captures market momentum through Bollinger Bands breakouts while using price mean reversion for profit-taking and implementing stop-loss for risk control. It employs 3x leverage, ensuring returns while thoroughly considering risk management.
Strategy Principles
The core logic is based on the following key elements:
- Uses 20-period moving average as the middle band, with 2 standard deviations for the volatility range
- Entry signals: Long when candle body (average of open and close) breaks above upper band, short when breaks below lower band
- Exit signals: Close long positions when two consecutive candles have both open and close prices below the upper band and close below open; reverse logic for short positions
- Risk control: Sets stop-loss at current candle high/low points to ensure controlled losses per trade
Strategy Advantages
- Clear trading logic: Combines trend and reversion trading approaches for good performance in various market conditions
- Comprehensive risk control: Implements dynamic stop-loss based on candle volatility for effective drawdown control
- False signal filtering: Confirms breakouts using candle body position rather than just closing price to reduce false breakout losses
- Sound money management: Dynamically adjusts position size based on account equity, balancing returns and risk
Strategy Risks
- Sideways market risk: May trigger frequent false breakout signals in ranging markets, leading to consecutive stops
- Leverage risk: 3x leverage may cause significant losses during extreme volatility
- Stop-loss setting risk: Using candle high/low points for stops may be too loose, increasing per-trade losses
- Timeframe dependency: 4-hour timeframe may react too slowly in certain market conditions, missing opportunities
Strategy Optimization Directions
- Implement trend filter: Add longer-term trend indicators to trade in primary trend direction
- Optimize stop-loss approach: Consider using ATR or Bollinger Band width for dynamic stop-loss distances
- Enhance position management: Dynamically adjust leverage based on volatility or trend strength
- Add market condition analysis: Incorporate volume or volatility indicators to identify market states for selective entry
Summary
This strategy combines Bollinger Bands' trend-following and mean-reversion characteristics, achieving stable returns in both trending and ranging markets through strict entry/exit conditions and risk control measures. Its core strengths lie in clear trading logic and comprehensive risk management system, but attention must be paid to leverage usage and market condition judgment optimization to further improve strategy stability and profitability.
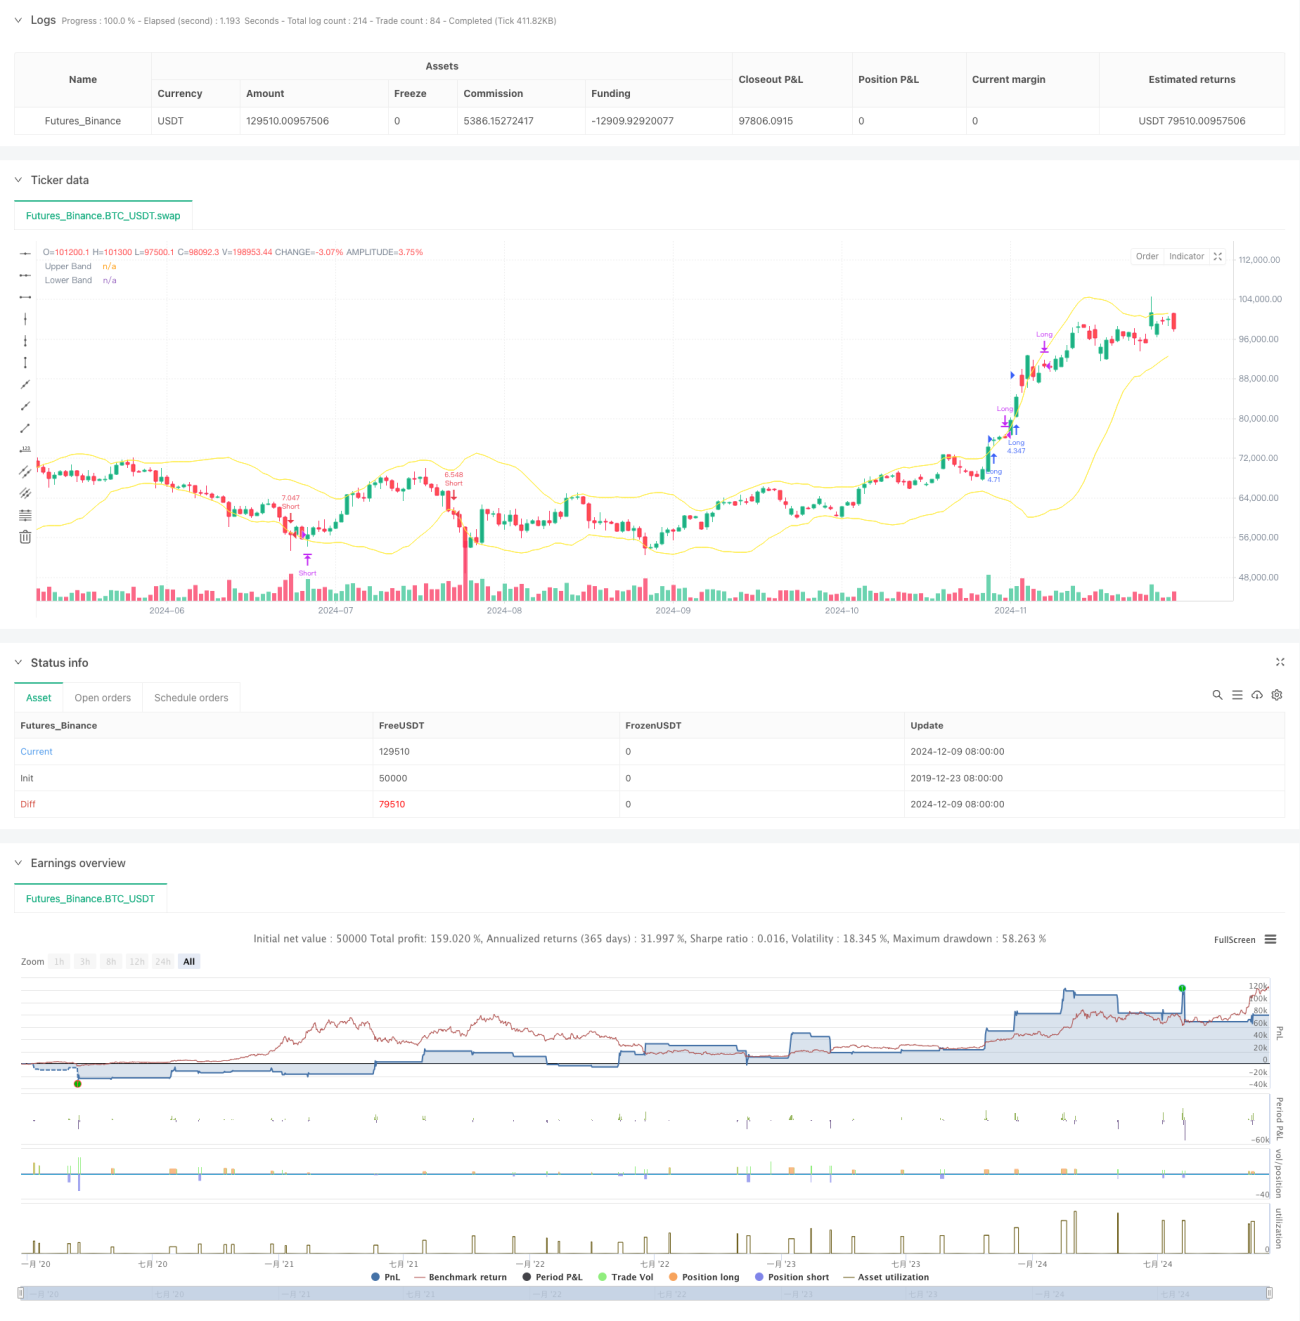
/*backtest
start: 2019-12-23 08:00:00
end: 2024-12-10 08:00:00
period: 1d
basePeriod: 1d
exchanges: [{"eid":"Futures_Binance","currency":"BTC_USDT"}]
*/

//@version=5
strategy("Bollinger 4H Follow", overlay=true, initial_capital=300, commission_type=strategy.commission.percent, commission_value=0.04)
// StartYear = input(2022,"Backtest Start Year")
// StartMonth = input(1,"Backtest Start Month") - 1