
Overview
This strategy is an intelligent trading system based on the Relative Strength Index (RSI), combining various moving averages and Bollinger Bands to time trades by identifying market overbought and oversold zones. The core mechanism relies on RSI breakthrough and pullback signals, complemented by different types of moving averages for trend confirmation, enabling efficient swing trading. The strategy demonstrates strong adaptability and can be adjusted for different market conditions.
Strategy Principle
The strategy utilizes a 14-period RSI as its core indicator, generating trading signals by monitoring RSI crossovers with key levels at 30 and 70. A long signal is triggered when RSI breaks above 30, indicating a shift from oversold to bullish conditions. A closing signal is generated when RSI falls below 70, suggesting a transition from overbought to bearish conditions. The strategy incorporates various moving averages (SMA, EMA, SMMA, WMA, VWMA) and Bollinger Bands as supplementary indicators for trend confirmation and volatility assessment.
Strategy Advantages
- Clear Signals: RSI's overbought and oversold signals are distinct and easy to understand
- Risk Control: Well-defined entry and exit conditions enable effective risk management
- Flexibility: Support for multiple moving average types allows adaptation to market conditions
- Adaptability: Bollinger Bands automatically adjust trading ranges based on market volatility
- Easy Optimization: Strong parameter customization facilitates market-specific adjustments
Strategy Risks
- Sideways Market Risk: May generate frequent false breakout signals in ranging markets
- Trend Continuation Risk: Early exits might miss extended trend movements
- Parameter Sensitivity: Different parameter settings can significantly affect strategy performance
- Slippage Impact: Less liquid markets may experience significant slippage
- Systematic Risk: Consecutive losses possible in extreme market conditions
Strategy Optimization Directions
- Volume Integration: Confirm signal validity through volume analysis
- Trend Filter Addition: Incorporate longer-term trend analysis to avoid counter-trend trades
- Stop-Loss Enhancement: Implement dynamic stop-loss mechanisms for improved capital efficiency
- Position Management Refinement: Adjust position sizes based on market volatility
- Market Sentiment Integration: Combine additional technical indicators to improve signal accuracy
Summary
This strategy captures market overbought and oversold opportunities through the RSI indicator, confirming signals with multiple technical indicators, demonstrating strong practicality and reliability. The strategy design thoroughly considers risk control and can adapt to various market environments through parameter optimization and indicator combinations. Traders are advised to conduct comprehensive backtesting before live implementation and adjust parameters according to specific market characteristics.
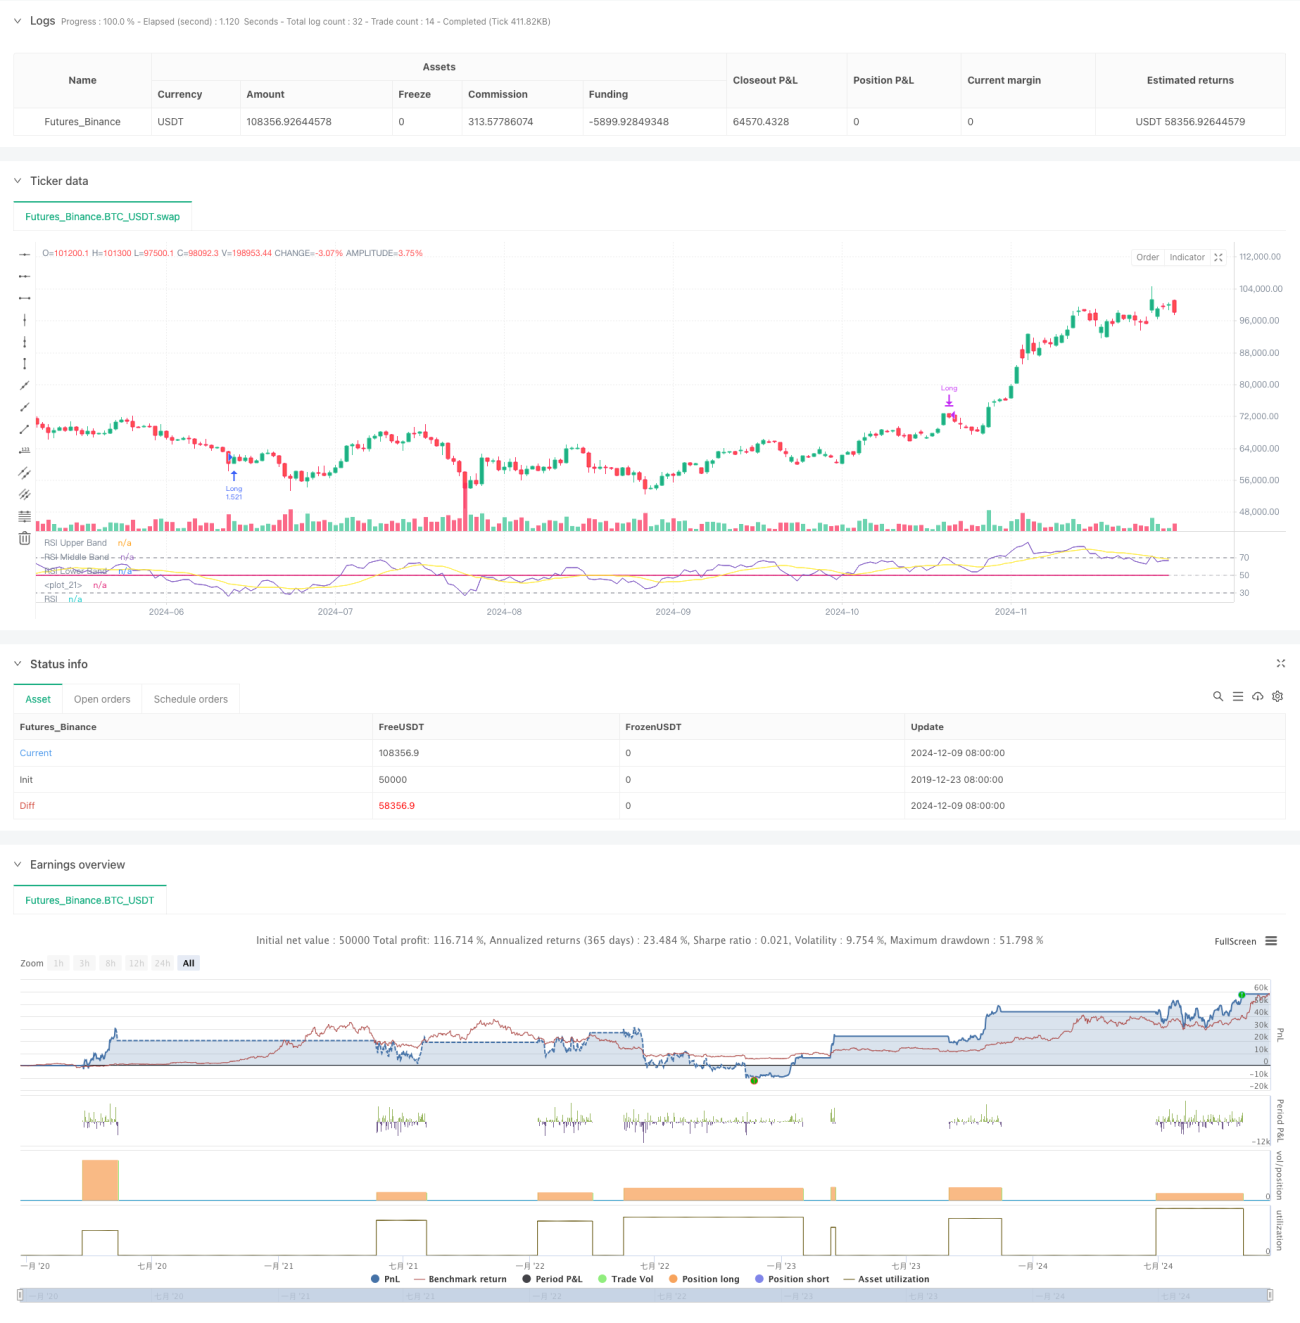
/*backtest
start: 2019-12-23 08:00:00
end: 2024-12-10 08:00:00
period: 1d
basePeriod: 1d
exchanges: [{"eid":"Futures_Binance","currency":"BTC_USDT"}]
*/

//@version=5
strategy(title="Demo GPT - Relative Strength Index", shorttitle="RSI Strategy", overlay=false, default_qty_type=strategy.percent_of_equity, default_qty_value=100, commission_value=0.1, slippage=3)

// Inputs- 1