
Overview
This strategy is a comprehensive trading system that combines the Relative Strength Index (RSI), Moving Average Convergence Divergence (MACD), Bollinger Bands (BB), and Volume analysis. Through the coordination of multi-dimensional technical indicators, the strategy conducts a comprehensive analysis of market trends, volatility, and volume to identify optimal trading opportunities.
Strategy Principle
The core logic of the strategy is based on the following aspects:
- Uses RSI(14) to judge market overbought/oversold conditions, with RSI below 30 considered oversold
- Utilizes MACD(12,26,9) to determine trend direction, with MACD golden cross as a long signal
- Confirms price trend validity through calculating the difference between up and down volume (Delta Volume)
- Incorporates Bollinger Bands to evaluate price volatility for optimizing entry timing
- System generates best buy signals when RSI is oversold, MACD shows golden cross, and Delta Volume is positive
- Automatically closes positions when MACD shows death cross or RSI exceeds 60 for risk control
Strategy Advantages
- Multiple indicator cross-validation improves trading signal reliability
- Volume analysis confirms price trend validity
- Includes adaptive moving average type selection, enhancing strategy flexibility
- Contains comprehensive risk control mechanisms, including stop-loss and take-profit settings
- Strategy parameters can be optimized for different market conditions
Strategy Risks
- Multiple indicator combination may lead to signal lag
- False signals may occur in ranging markets
- Parameter optimization may result in overfitting
- High-frequency trading may incur significant transaction costs
- Market volatility may cause substantial drawdowns
Strategy Optimization Directions
- Introduce adaptive parameter mechanisms to dynamically adjust indicator parameters based on market conditions
- Add trend strength filters to reduce false signals in ranging markets
- Optimize stop-loss and take-profit mechanisms to improve capital efficiency
- Incorporate volatility filters to adjust positions in high-volatility environments
- Develop intelligent fund management systems for dynamic position control
Summary
This is a composite trading strategy integrating multiple technical indicators, capturing market opportunities through multi-dimensional analysis including RSI, MACD, and volume. The strategy demonstrates strong adaptability and scalability, along with comprehensive risk control mechanisms. Through continuous optimization and improvement, this strategy has the potential to maintain stable performance across different market environments.
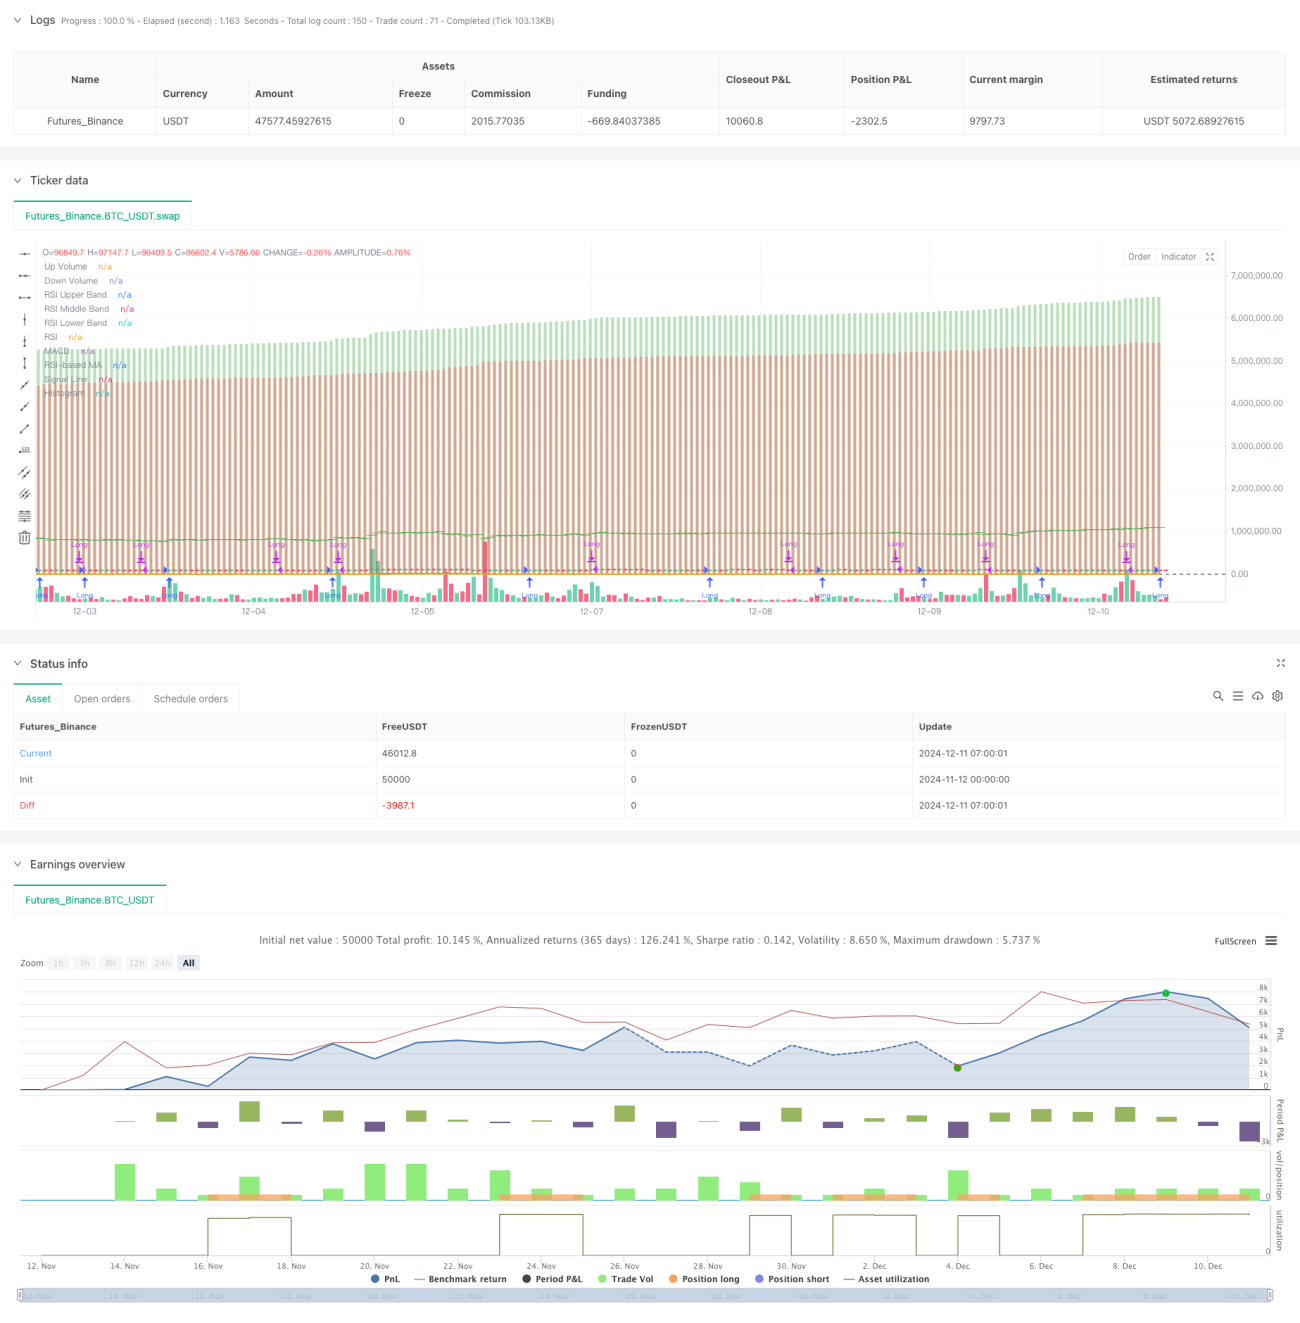
/*backtest
start: 2024-11-12 00:00:00
end: 2024-12-11 08:00:00
period: 1h
basePeriod: 1h
exchanges: [{"eid":"Futures_Binance","currency":"BTC_USDT"}]
*/

//@version=5
strategy("Liraz sh Strategy - RSI MACD Strategy with Bullish Engulfing and Net Volume", overlay=true, currency=currency.NONE, initial_capital=100000, commission_type=strategy.commission.percent, commission_value=0.1, slippage=3)

// Input parameters- 1