概述
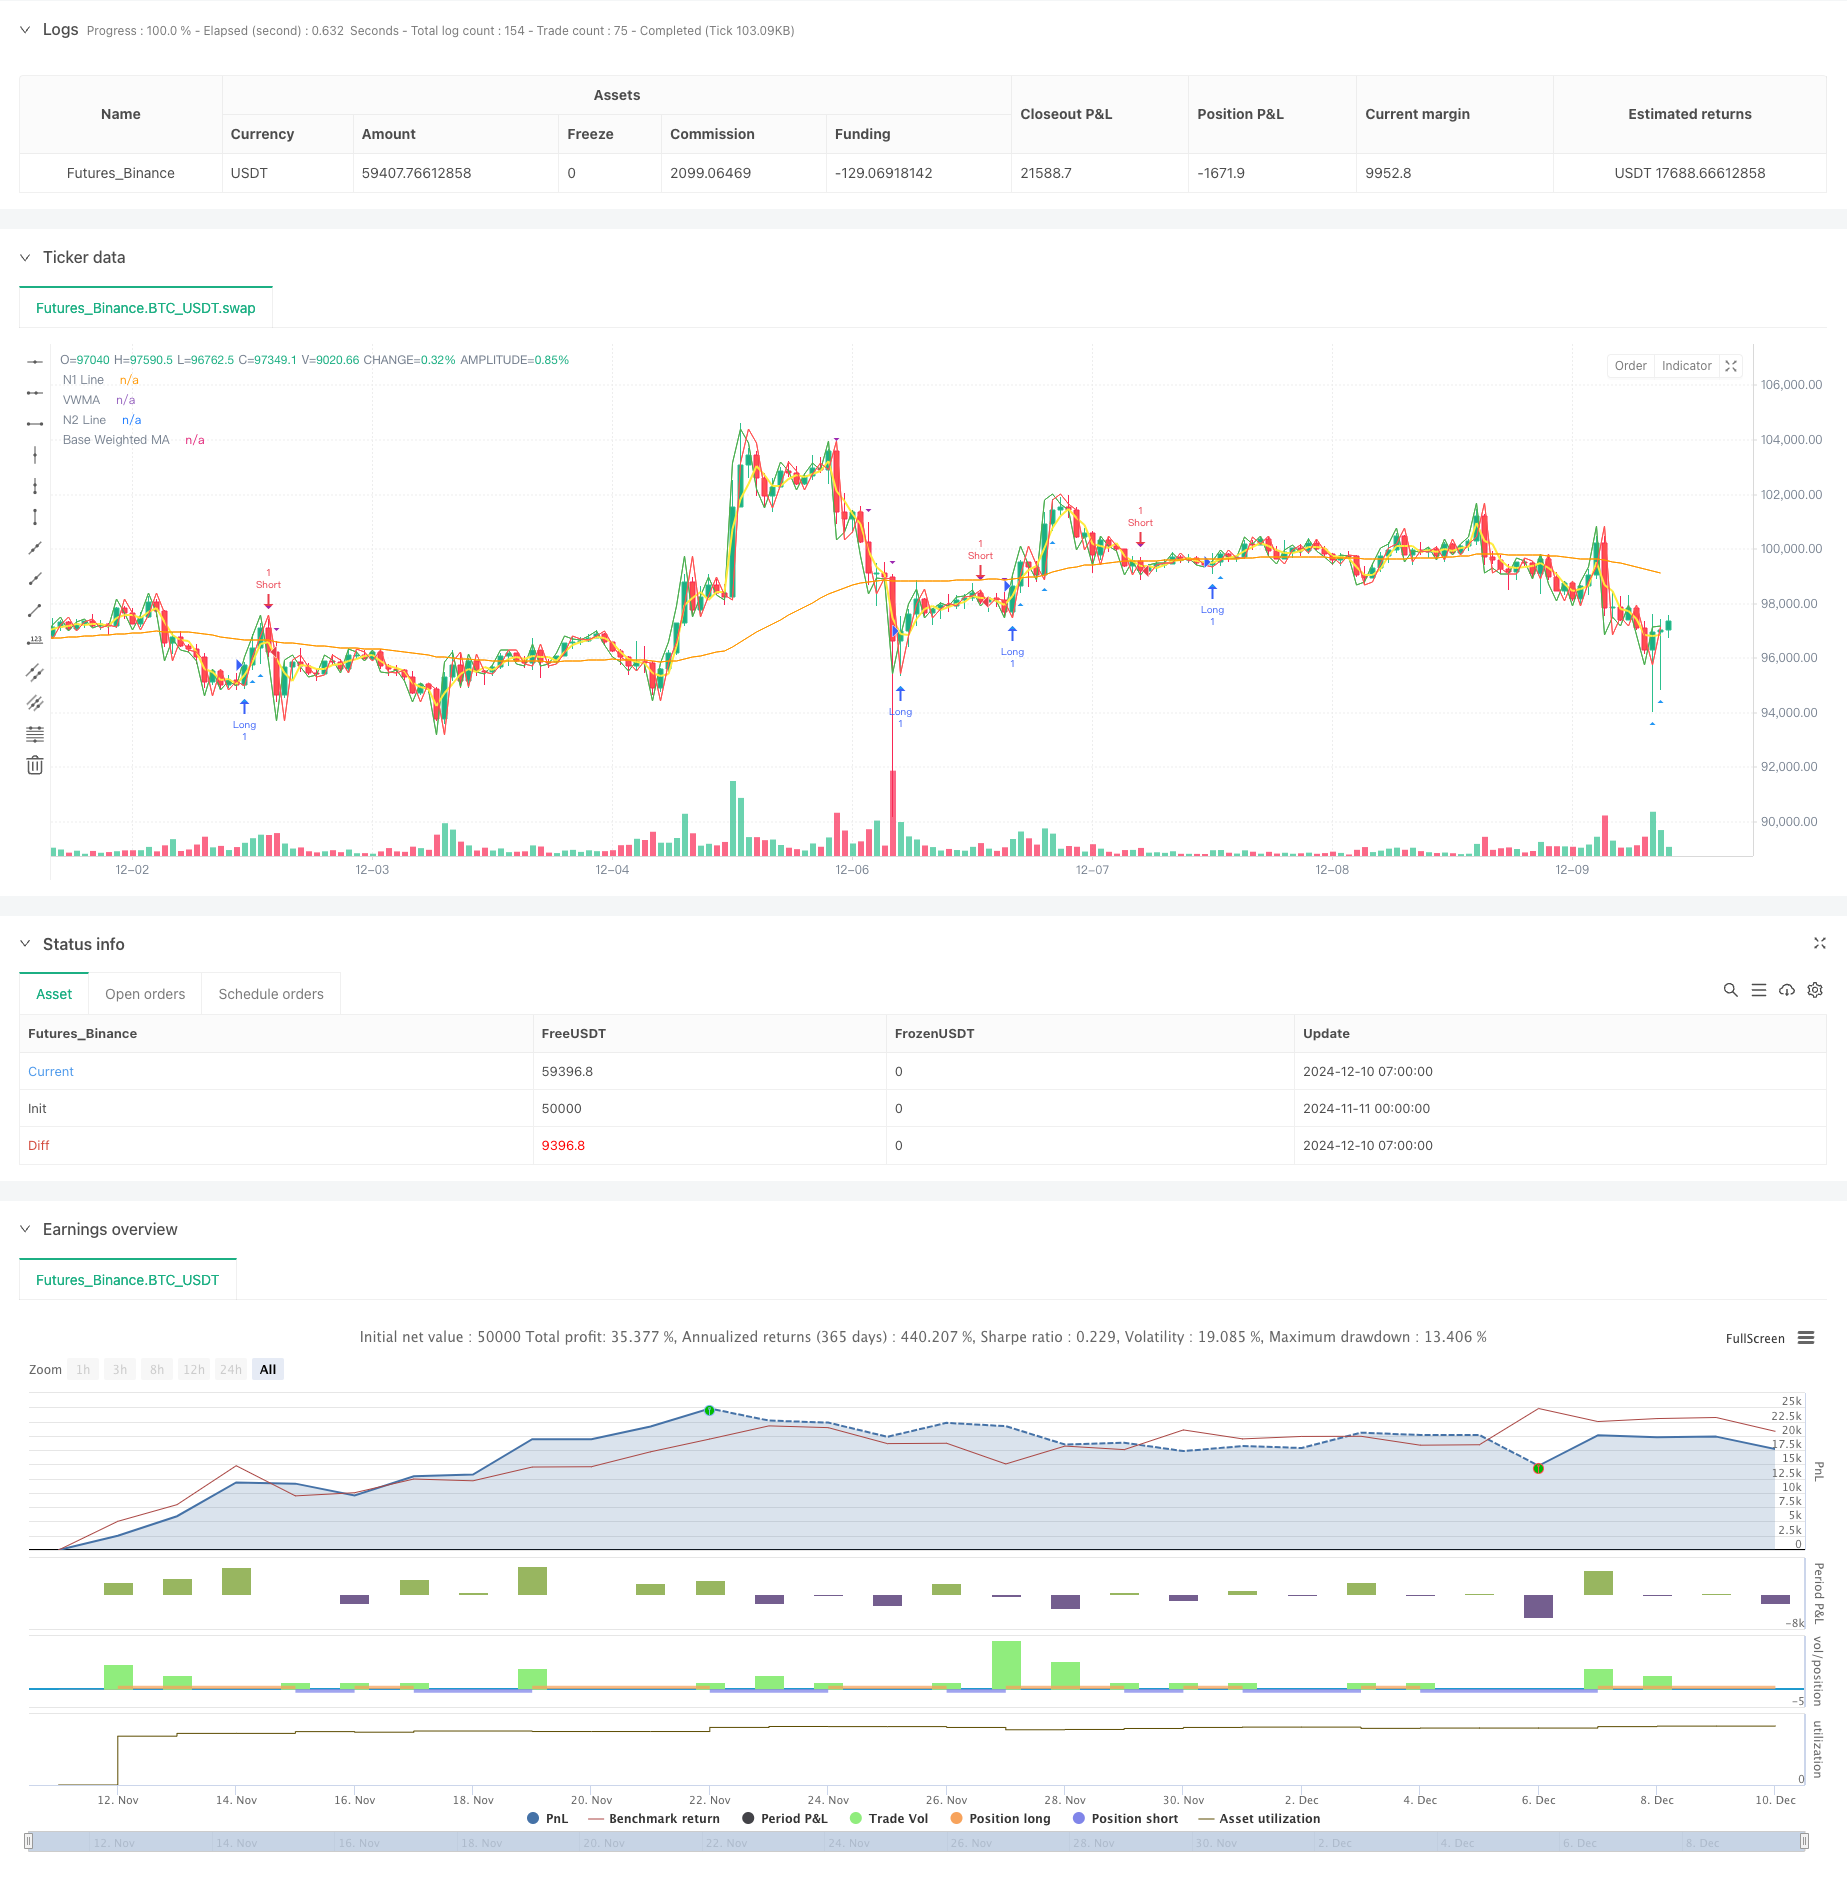
该策略是一个结合了多重均线、相对强弱指标(RSI)、平均趋向指标(ADX)和成交量分析的综合量化交易系统。策略通过多重技术指标的协同配合,在趋势确认的基础上进行交易,通过成交量和动量指标的过滤来提高交易的可靠性。
策略原理
策略的核心逻辑基于以下几个关键组件: 1. 使用双重赫尔均线(Double HullMA)、成交量加权移动平均线(VWMA)和基础加权移动平均线(WMA)构建多重均线系统 2. 通过ADX指标判断趋势强度,只在趋势明显时进行交易 3. 利用RSI指标过滤极端市场状态,避免在过度买入或卖出区域交易 4. 结合成交量分析,要求交易信号出现时成交量高于一定阈值 5. 通过n1和n2线的交叉来确定具体的交易方向
多重均线系统提供了价格趋势的基准判断,ADX确保只在趋势足够强时交易,RSI帮助避免追涨杀跌,而成交量分析则确保交易发生在市场活跃度较高的时期。
策略优势
- 多重确认机制降低了假突破的风险
- 结合技术指标和成交量分析提高了交易的可靠性
- 通过RSI过滤极端市场状态,避免在不利时机入场
- ADX的使用确保只在趋势明显时交易,提高胜率
- 成交量要求帮助确认市场共识
- 策略逻辑清晰,参数可调整性强
策略风险
- 多重过滤条件可能导致错过部分交易机会
- 在震荡市场中可能表现不佳
- 参数优化可能导致过度拟合
- 均线系统在快速反转行情中可能反应滞后
- 成交量过滤可能在低流动性市场中限制交易机会
建议通过以下方式管理风险: - 根据不同市场特点调整参数 - 设置适当的止损止盈 - 控制每次交易的资金比例 - 定期回测验证策略有效性
策略优化方向
- 引入自适应参数机制,根据市场状态动态调整
- 增加市场波动率过滤器,在高波动期间调整仓位
- 完善出场机制,可考虑加入追踪止损
- 优化成交量过滤器,考虑相对成交量而非绝对值
- 加入时间过滤,避开重要消息发布期
- 考虑加入价格波动率指标,提高对市场风险的识别能力
总结
该策略通过多重技术指标的协同配合,构建了一个相对完善的趋势跟踪系统。策略的主要特点是通过多重确认来提高交易的可靠性,同时通过各种过滤器来控制风险。虽然可能会错过一些交易机会,但总体上有助于提高交易的稳定性。通过建议的优化方向,策略还有进一步提升的空间。
策略源码
/*backtest
start: 2024-11-11 00:00:00
end: 2024-12-10 08:00:00
period: 1h
basePeriod: 1h
exchanges: [{"eid":"Futures_Binance","currency":"BTC_USDT"}]
*/

//@version=5
strategy("Optimized Multi-MA Strategy with Volume, ADX and RSI", overlay=true)

// Kullanıcı Parametreleri
keh = input.int(3, title="Double HullMA", minval=1)
teh = input.int(3, title="Volume-Weighted MA", minval=1)
yeh = input.int(75, title="Base Weighted MA", minval=1)
rsiPeriod = input.int(14, title="RSI Period", minval=1)
adxPeriod = input.int(14, title="ADX Period", minval=1)
volumeLookback = input.int(10, title="Volume Lookback Period", minval=1)  // Son X mumun hacmi
adxThreshold = input.int(20, title="ADX Trend Strength Threshold", minval=1) // ADX için trend gücü eşiği

// Hareketli Ortalamalar
rvwma = ta.vwma(close, teh)
yma = ta.wma(close, yeh)
n2ma = 2 * ta.wma(close, math.round(keh / 2))
nma = ta.wma(close, keh)
diff = n2ma - nma
sqrtKeh = math.round(math.sqrt(keh))
n1 = ta.wma(diff, sqrtKeh)
n2 = ta.wma(diff[1], sqrtKeh)

// ADX Hesaplaması
trueRange = ta.rma(ta.tr, adxPeriod)
plusDM = ta.rma(math.max(high - high[1], 0), adxPeriod)
minusDM = ta.rma(math.max(low[1] - low, 0), adxPeriod)
plusDI = (plusDM / trueRange) * 100
minusDI = (minusDM / trueRange) * 100
dx = math.abs(plusDI - minusDI) / (plusDI + minusDI) * 100
adx = ta.rma(dx, adxPeriod)
trendIsStrong = adx > adxThreshold

// RSI Filtreleme
rsiValue = ta.rsi(close, rsiPeriod)
rsiFilter = rsiValue > 30 and rsiValue < 70  // Aşırı alım ve aşırı satım bölgelerinin dışında olmak

// Hacim Filtresi
volumeThreshold = ta.sma(volume, volumeLookback)  // Ortalama hacim seviyesi
highVolume = volume > volumeThreshold

// Sinyal Şartları (Sadece güçlü trendler ve rsi'nın aşırı bölgelerde olmaması)
longCondition = n1 > n2 and close > rvwma and trendIsStrong and rsiFilter and highVolume
shortCondition = n1 < n2 and close < rvwma and trendIsStrong and rsiFilter and highVolume

// Hacim Filtresi ile İşaretler
plotshape(series=longCondition and highVolume ? close : na, style=shape.triangleup, location=location.belowbar, color=color.blue, size=size.small, title="High Volume Long Signal")
plotshape(series=shortCondition and highVolume ? close : na, style=shape.triangledown, location=location.abovebar, color=color.purple, size=size.small, title="High Volume Short Signal")

// Strateji Giriş ve Çıkış Şartları
if (longCondition)
    strategy.entry("Long", strategy.long)

if (shortCondition)
    strategy.entry("Short", strategy.short)

// Görsel Göstergeler
plot(n1, color=color.green, title="N1 Line")
plot(n2, color=color.red, title="N2 Line")
plot(rvwma, color=color.yellow, linewidth=2, title="VWMA")
plot(yma, color=color.orange, title="Base Weighted MA")
相关推荐