
Overview
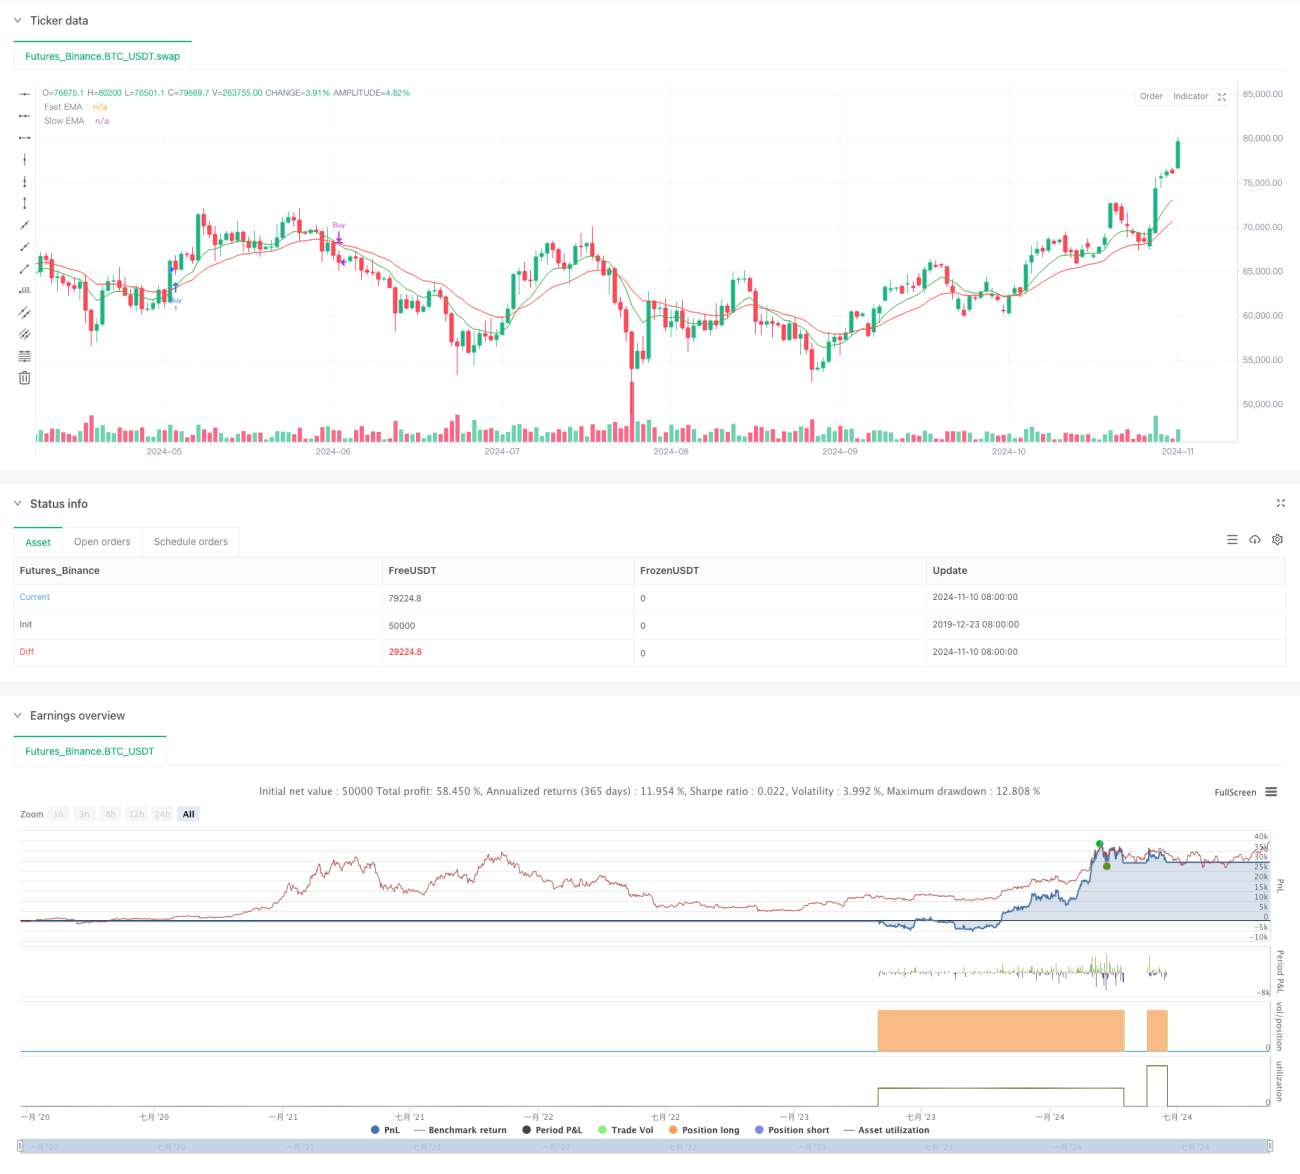
This strategy is a quantitative trading system based on multiple technical indicators, integrating Exponential Moving Average (EMA), Relative Strength Index (RSI), and Average Directional Index (ADX). The strategy uses EMA crossover signals as the primary entry criteria, combined with RSI for overbought/oversold confirmation and ADX for trend strength assessment, forming a complete trading decision system. The strategy also includes a risk management module that controls stop-loss and take-profit levels through a predefined risk-reward ratio.
Strategy Principles
The core logic of the strategy is based on the following key components:
- Uses 9-period and 21-period EMAs as the main signal system, generating buy signals when the fast line crosses above the slow line and sell signals when it crosses below
- Incorporates RSI as a filter, requiring RSI below 60 for buy signals to avoid entering in overbought areas, and above 40 for sell signals to avoid exiting in oversold areas
- Utilizes ADX to confirm trend strength, executing trades only when ADX is above 20 to ensure entry in clear trends
- In terms of money management, the strategy employs a 2.0 risk-reward ratio for setting profit targets and stop losses
Strategy Advantages
- Integration of multiple technical indicators improves signal reliability and reduces false signals
- EMA crossover system effectively captures trend reversal points
- RSI filter effectively prevents unfavorable entries in extreme zones
- ADX incorporation ensures trading only in clear trends, improving win rate
- Fixed risk-reward ratio settings support stable long-term capital growth
- Strategy features a clear graphical interface with trade signal markers and price labels
Strategy Risks
- Multiple indicators may lead to signal lag, affecting entry timing
- May generate frequent crossover signals in ranging markets, increasing trading costs
- Fixed RSI and ADX thresholds may not be suitable for all market conditions
- Preset risk-reward ratio may not be appropriate for all market phases
- Lack of volume consideration may affect signal reliability
Strategy Optimization Directions
- Introduce adaptive indicator parameters, dynamically adjusting EMA periods based on market volatility
- Add volume confirmation mechanism to improve signal reliability
- Develop dynamic RSI and ADX thresholds to adapt to different market environments
- Dynamically adjust risk-reward ratio based on market volatility
- Add time filters to avoid trading during unfavorable periods
- Incorporate market environment recognition module to use different parameter settings in different market states
Summary
This is a well-designed strategy with complete logic incorporating multiple technical indicators. Through the integration of EMA, RSI, and ADX, the strategy demonstrates good performance in trend following and risk control. While there are areas for optimization, the strategy has good practical value and room for expansion. Performance can be further improved through the suggested optimization directions.
- 1