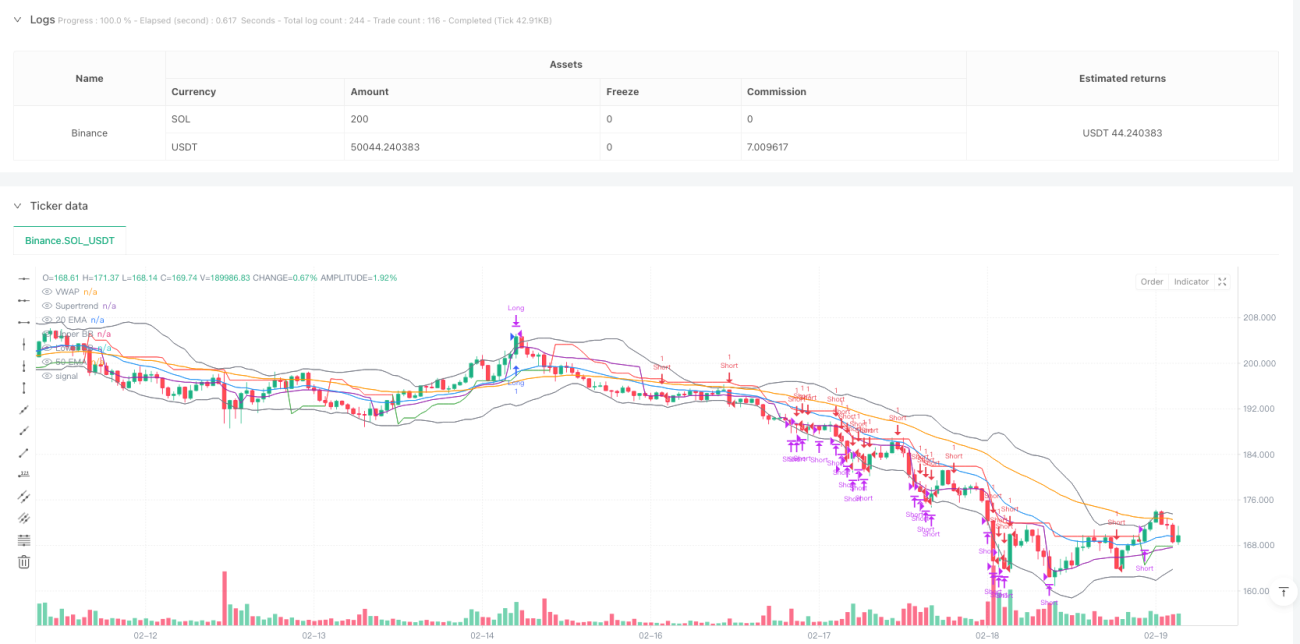
该策略是一个结合了趋势跟踪和区间交易的自适应交易系统。它通过多个技术指标的协同配合,在不同的市场环境下灵活切换交易模式。策略使用Supertrend、移动均线、ADX、RSI和布林带等指标来识别市场状态并确定交易信号,同时结合VWAP进行价格参考,并设置了止损机制来控制风险。
策略的核心逻辑分为两个部分:趋势跟踪和区间交易。在趋势市场中(由ADX>25判定),策略依据Supertrend方向、EMA交叉和VWAP位置产生信号;在震荡市场中,策略利用布林带边界和RSI超买超卖水平进行交易。具体来说: - 趋势跟踪模式:当ADX>25时启用,结合20/50周期EMA的位置关系、Supertrend方向和价格相对VWAP的位置综合判断 - 区间交易模式:当ADX<25时启用,在价格触及布林带边界且RSI达到极值时入场 - 出场条件包括:止损触发、Supertrend反转或RSI达到极值
这是一个设计合理、逻辑完整的综合性策略。通过多指标配合和模式切换,在不同市场环境下都能保持一定的适应性。虽然存在一些潜在风险,但通过合理的风险控制和持续优化,该策略具有良好的实战应用价值。建议在实盘使用时进行充分的参数优化和回测验证。
/*backtest
start: 2025-01-27 00:00:00
end: 2025-02-20 00:00:00
period: 1h
basePeriod: 1h
exchanges: [{"eid":"Binance","currency":"SOL_USDT"}]
*/
//@version=5
strategy("Nifty/BankNifty Multi-Strategy v2", overlay=true, margin_long=100, margin_short=100)
// ———— Inputs ———— //
// Supertrend
atrPeriod = input.int(10, "ATR Period")
supertrendMultiplier = input.float(2.0, "Supertrend Multiplier", step=0.1)
// EMA
ema20Period = input.int(20, "20 EMA Period")
ema50Period = input.int(50, "50 EMA Period")
// ADX/DMI
adxThreshold = input.int(25, "ADX Trend Threshold")
adxLength = input.int(14, "ADX Length")
// RSI
rsiLength = input.int(14, "RSI Length")
rsiOverbought = input.int(70, "RSI Overbought")
rsiOversold = input.int(30, "RSI Oversold")
// Bollinger Bands
bbLength = input.int(20, "BB Length")
bbStdDev = input.float(2.0, "BB Std Dev", step=0.1)
// Stop-Loss
stopLossPerc = input.float(1.0, "Stop-Loss %", step=0.1)
// ———— Calculations ———— //
// Supertrend
[supertrend, direction] = ta.supertrend(supertrendMultiplier, atrPeriod)
// EMAs
ema20 = ta.ema(close, ema20Period)
ema50 = ta.ema(close, ema50Period)
// ADX via DMI (corrected)
[dip, din, adx] = ta.dmi(adxLength, adxLength) // ta.dmi(diLength, adxSmoothing)
// RSI
rsi = ta.rsi(close, rsiLength)
// Bollinger Bands
basis = ta.sma(close, bbLength)
upperBB = basis + ta.stdev(close, bbLength) * bbStdDev
lowerBB = basis - ta.stdev(close, bbLength) * bbStdDev
// VWAP
vwapValue = ta.vwap(hlc3)
// ———— Strategy Logic ———— //
trendingMarket = adx > adxThreshold
// Trend-Following Strategy
emaBullish = ema20 > ema50
priceAboveVWAP = close > vwapValue
longConditionTrend = trendingMarket and direction < 0 and emaBullish and priceAboveVWAP
shortConditionTrend = trendingMarket and direction > 0 and not emaBullish and close < vwapValue
// Range-Bound Strategy
priceNearLowerBB = close <= lowerBB
priceNearUpperBB = close >= upperBB
longConditionRange = not trendingMarket and priceNearLowerBB and rsi < rsiOversold
shortConditionRange = not trendingMarket and priceNearUpperBB and rsi > rsiOverbought
// ———— Entries/Exits ———— //
if (longConditionTrend or longConditionRange)
strategy.entry("Long", strategy.long)
stopPriceLong = strategy.position_avg_price * (1 - stopLossPerc / 100)
strategy.exit("Exit Long", "Long", stop=stopPriceLong)
if (shortConditionTrend or shortConditionRange)
strategy.entry("Short", strategy.short)
stopPriceShort = strategy.position_avg_price * (1 + stopLossPerc / 100)
strategy.exit("Exit Short", "Short", stop=stopPriceShort)
// Exit on Supertrend flip or RSI extremes
if (direction > 0 or rsi >= rsiOverbought)
strategy.close("Long")
if (direction < 0 or rsi <= rsiOversold)
strategy.close("Short")
// ———— Visualization ———— //
plot(supertrend, "Supertrend", color = direction < 0 ? color.green : color.red)
plot(ema20, "20 EMA", color.blue)
plot(ema50, "50 EMA", color.orange)
plot(vwapValue, "VWAP", color.purple)
plot(upperBB, "Upper BB", color.gray)
plot(lowerBB, "Lower BB", color.gray)