Moving Average and Relative Strength Index Strategy

Overview
This strategy combines two technical indicators: Moving Average (MA) and Relative Strength Index (RSI). It generates buy and sell signals based on the crossover of fast and slow moving averages and the overbought/oversold signals from RSI. A buy signal is generated when the fast moving average crosses above the slow moving average and RSI is above the oversold threshold. A sell signal is generated when the fast moving average crosses below the slow moving average or RSI is above the overbought threshold.
Strategy Principle
This strategy leverages the characteristics of moving averages and relative strength index. Moving averages can reflect the trend direction of prices. The fast moving average is more sensitive to price changes, while the slow moving average has a relatively lagging response. When the fast moving average crosses above the slow moving average, it indicates an upward price trend and a potential buying opportunity. Conversely, it indicates a downward price trend and a potential selling opportunity. The relative strength index measures the magnitude of price changes over a period of time. When RSI is above the overbought threshold (e.g., 70), it suggests that the market may be overheated and there is a risk of price pullback. When RSI is below the oversold threshold (e.g., 30), it suggests that the market may be overcooled and there is a chance of price rebound.
By combining the trend-following feature of moving averages and the overbought/oversold feature of relative strength index, this strategy can capture trending markets while avoiding some overbought/oversold risks. It is a quantitative strategy that incorporates both trend-following and mean-reversion approaches.
Strategy Advantages
- Simple and easy to use: The strategy logic is clear and only uses two common technical indicators, making it suitable for beginners in quantitative trading.
- Trend-following: By using the crossover of fast and slow moving averages, the strategy can trade in the direction of price trends.
- Risk control: The introduction of relative strength index as an auxiliary judgment helps control some overbought/oversold risks while trend trading.
- Adaptability: The parameters of moving averages and relative strength index can be optimized according to different market characteristics, providing good adaptability.
Strategy Risks
- Parameter sensitivity: The calculation period parameters of moving averages and relative strength index have a significant impact on the strategy performance. Different parameters may produce different results.
- Oscillating market risk: When the market exhibits wide-range oscillations, the strategy may generate more false signals, leading to increased losses.
- Trend reversal risk: When the market trend reverses, the strategy may experience consecutive losses.
- Ignoring fundamentals: The strategy is entirely based on price movements and does not consider the impact of macroeconomic factors, industry trends, and other fundamental factors.
Strategy Optimization Directions
- Parameter optimization: Conduct backtesting on historical data to find the optimal combination of moving average and relative strength index parameters to improve strategy stability.
- Trend filtering: Add long-term moving averages or price channels as trend filtering indicators. Confirm the major trend before trading to reduce false signals in oscillating markets.
- Stop-loss and take-profit: Set reasonable stop-loss and take-profit conditions to control single-trade risk and improve the strategy's risk-reward ratio.
- Position sizing: Dynamically adjust position sizes based on market trend strength, price volatility, and other factors to reduce drawdown during trend reversals.
- Multi-factor combination: Combine other technical indicators such as volume-price indicators and sentiment indicators to build a multi-factor model and enhance strategy robustness.
Summary
The Moving Average and Relative Strength Index strategy is a simple and practical quantitative trading strategy that captures market trends while controlling some risks through trend-following and overbought/oversold judgments. However, the strategy also has issues such as parameter sensitivity, oscillating market risks, and trend reversal risks. These problems need to be further addressed through parameter optimization, trend filtering, money management, and other methods. Additionally, quantitative traders need to flexibly adjust the strategy based on their risk preferences and market characteristics, and combine it with other signal factors to obtain more robust returns.
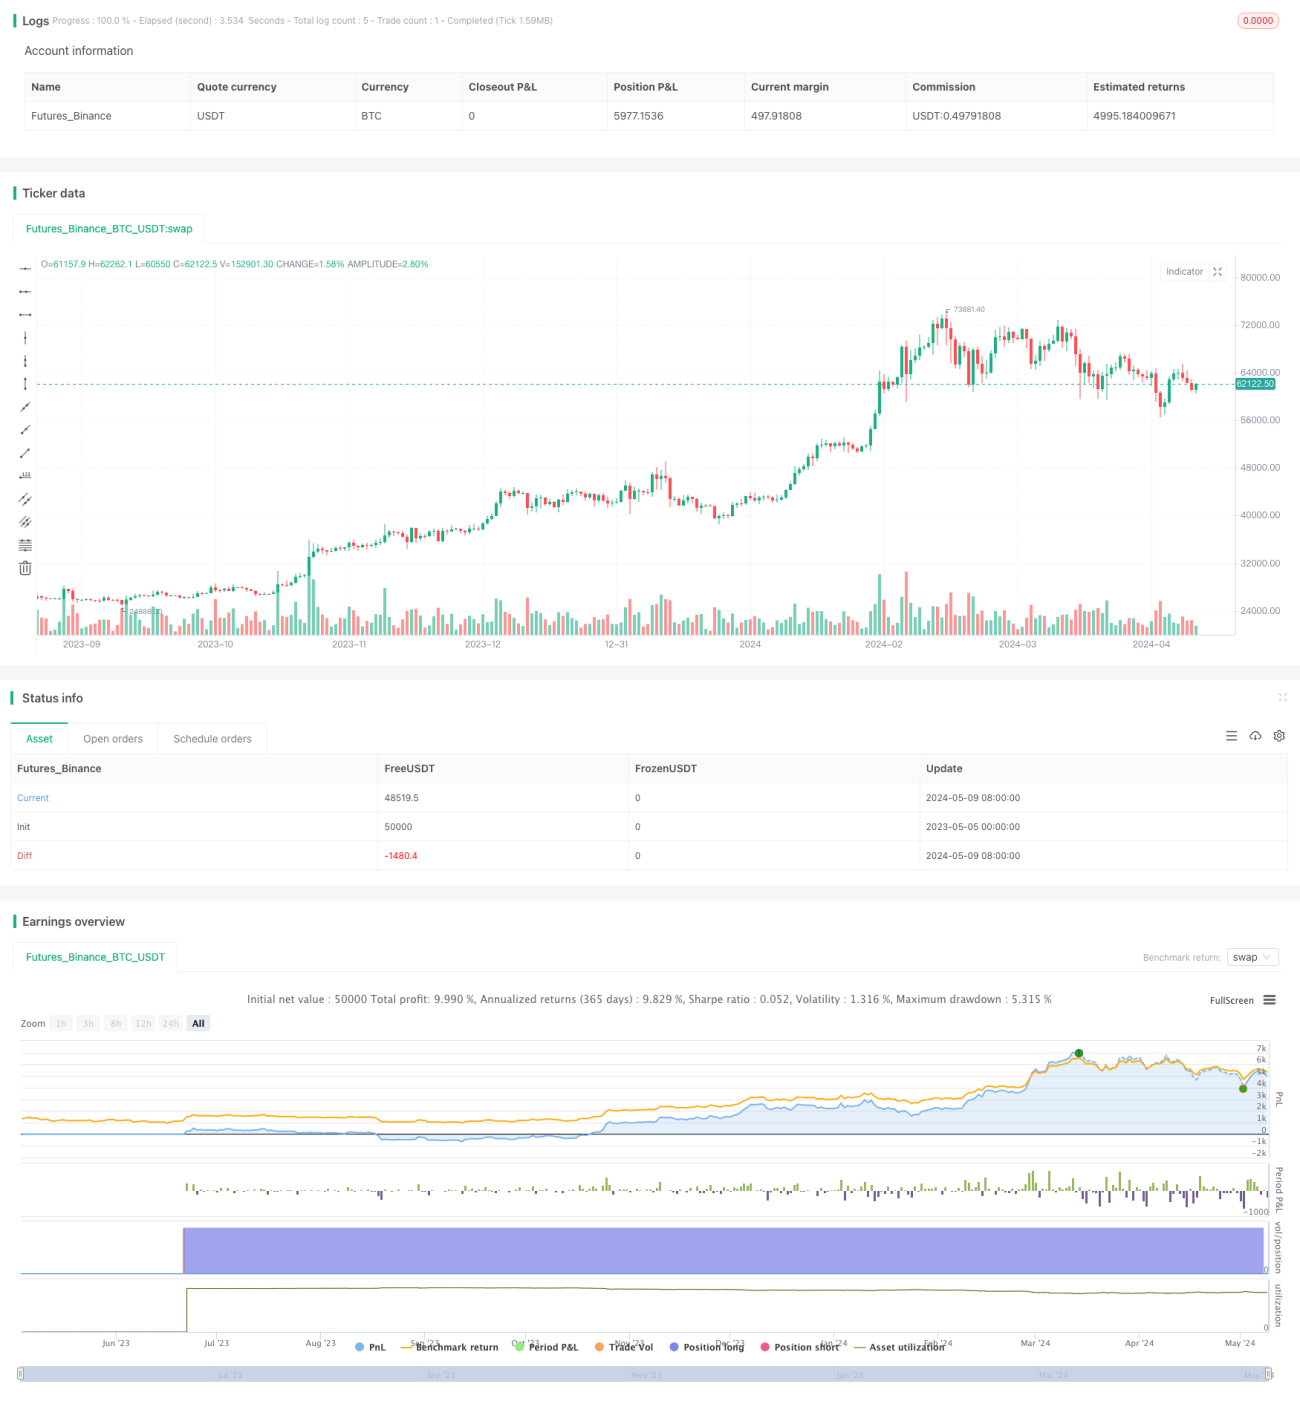
/*backtest
start: 2023-05-05 00:00:00
end: 2024-05-10 00:00:00
period: 1d
basePeriod: 1h
exchanges: [{"eid":"Futures_Binance","currency":"BTC_USDT"}]
*/

// This Pine Script™ code is subject to the terms of the Mozilla Public License 2.0 at https://mozilla.org/MPL/2.0/
// © giancarlo_meneguetti

//@version=5- 1