
Overview
This strategy is a trend following system based on multiple technical indicators, combining Moving Averages (EMA), Directional Movement Index (DMI), Detrended Price Oscillator (DPO), Relative Strength Index (RSI), and Average True Range (ATR). The core concept is to execute trades only after confirming multiple market characteristics including trend direction, momentum, and volatility to improve trading success rate.
Strategy Principles
The strategy employs a Triple Exponential Moving Average (EMA) system as its core trend identification mechanism, combined with other technical indicators for multiple signal confirmation:
- Fast EMA (10-day) captures short-term price momentum
- Medium EMA (25-day) serves as a medium-term trend filter
- Slow EMA (50-day) defines the overall trend direction
- DMI (14-day) confirms trend directional strength
- DPO confirms price deviation from trend
- RSI (14-day) measures momentum and overbought/oversold conditions
- ATR (14-day) sets stop-loss and profit targets
Trade Signal Conditions:
- Long: Fast EMA crosses above Medium EMA with both above Slow EMA, ADX>25, RSI>50, DPO>0
- Short: Fast EMA crosses below Medium EMA with both below Slow EMA, ADX>25, RSI<50, DPO<0
Strategy Advantages
- Multiple signal confirmation improves reliability and reduces false signals
- Combines trend following and momentum characteristics for effective trend capture
- Dynamic adjustment of stops and targets through ATR adapts to market volatility
- Systematic risk management limits each trade risk to 2% of account
- Clear strategy logic with well-defined component functions facilitates debugging and optimization
Strategy Risks
- May generate frequent false breakout signals in ranging markets
- Multiple indicator confirmation can lead to delayed entries
- Fixed ADX threshold may perform inconsistently across different market conditions
- Potentially significant drawdowns during quick market reversals
- Parameter optimization risks overfitting to historical data
Risk Control Measures:
- Dynamic ATR-based stops adapt to market volatility
- Fixed proportion risk management
- Multiple indicator cross-confirmation reduces false signals
Strategy Optimization Directions
- Introduce adaptive parameter mechanisms to dynamically adjust indicator parameters based on market conditions
- Add market environment recognition module to apply different trading rules in different market conditions
- Optimize exit mechanism by incorporating trend reversal signals and partial profit-taking
- Incorporate volume analysis to improve signal reliability
- Develop drawdown control mechanism to reduce position size or pause trading during consecutive losses
Summary
This strategy constructs a complete trend following trading system through the combination of multiple technical indicators. Its main features are strict signal confirmation and reasonable risk control, suitable for tracking medium to long-term trends on daily timeframes. While there is some lag in signals, the strategy demonstrates robust overall performance through strict risk control and multiple signal confirmation. When applying to live trading, careful consideration should be given to market environment selection and parameter optimization for specific instruments.
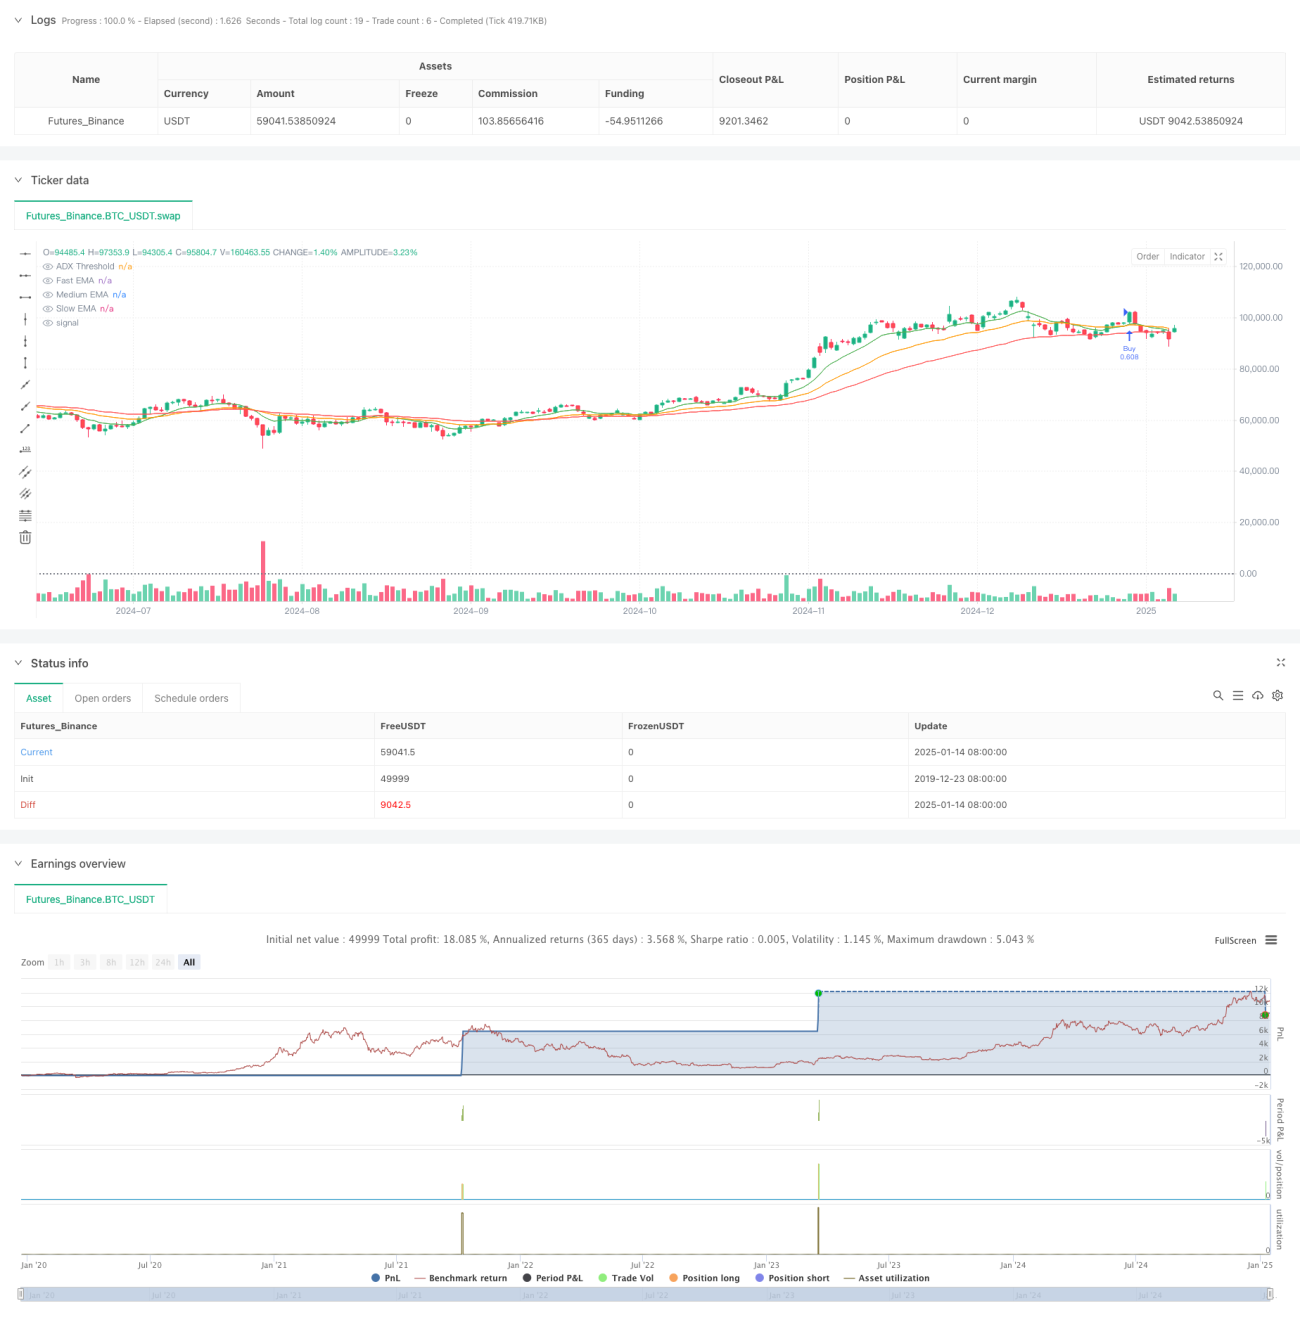
/*backtest
start: 2019-12-23 08:00:00
end: 2025-01-15 08:00:00
period: 1d
basePeriod: 1d
exchanges: [{"eid":"Futures_Binance","currency":"BTC_USDT","balance":49999}]
*/

//@version=5
strategy("Daily Strategy with Triple EMA, DMI, DPO, RSI, and ATR", overlay=true, default_qty_type=strategy.percent_of_equity, default_qty_value=100)

// Input parameters- 1