概述
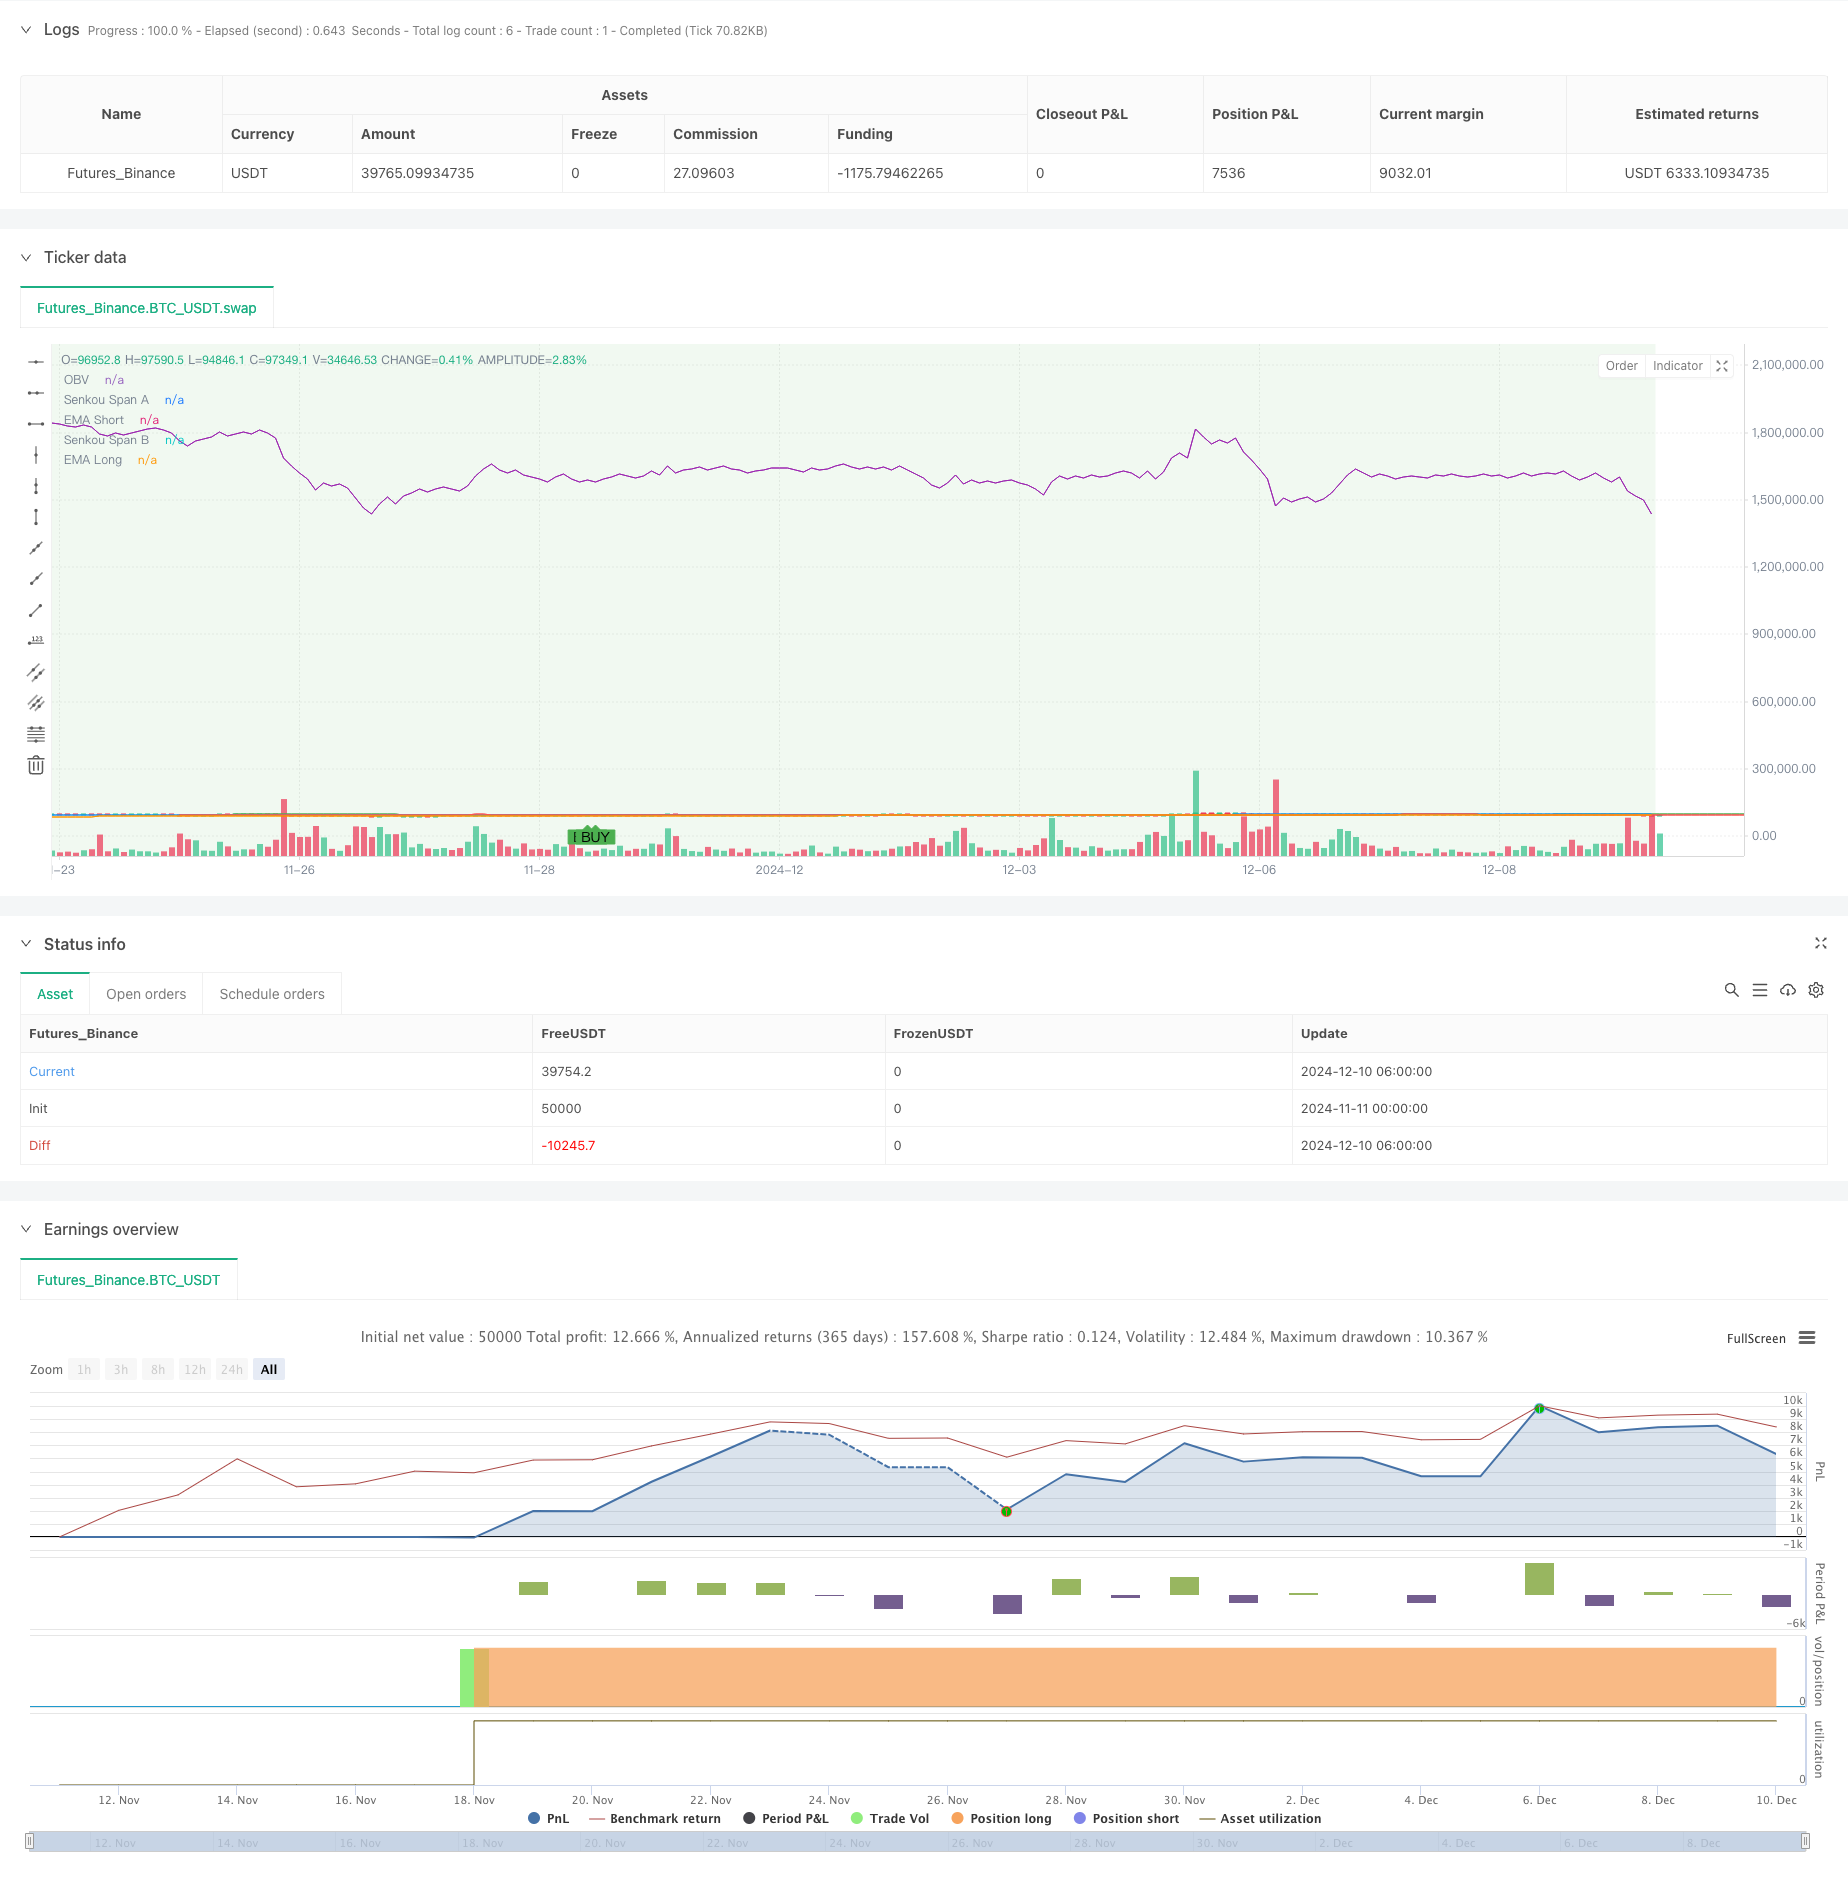
这是一个结合了多个技术指标的趋势跟踪与波动突破策略。该策略通过整合均线系统(EMA)、趋势强度指标(ADX)、市场波动指标(ATR)、量价分析(OBV)以及一些辅助指标如Ichimoku云图和随机指标(Stochastic)来捕捉市场趋势和突破机会。策略设置了严格的时间过滤器,仅在特定交易时段内运行,以提高交易效率。
策略原理
策略的核心逻辑基于多层技术指标的综合判断: 1. 使用50周期和200周期EMA构建趋势跟踪系统 2. 通过ADX指标确认趋势强度 3. 利用Ichimoku云图提供额外的趋势确认 4. 结合Stochastic指标识别超买超卖区域 5. 使用ATR动态设置止损和获利目标 6. 通过OBV验证成交量支持度
策略在满足以下条件时发出买入信号: - 处于允许交易时间段内 - 价格位于短期EMA之上 - 短期EMA位于长期EMA之上 - ADX高于设定阈值 - 价格位于云图上方 - Stochastic指标处于超卖区域
策略优势
- 多层技术指标交叉验证,提高信号可靠性
- 结合趋势跟踪和波动突破,增加策略适应性
- 通过时间过滤器避免低效交易时段
- 动态止损和获利目标设置,适应市场波动
- 量价结合分析,提供更全面的市场视角
- 系统化的进出场规则,减少主观判断
策略风险
- 多指标系统可能导致信号滞后
- 在横盘市场中可能产生过多假信号
- 参数优化难度较大,过度优化风险高
- 交易时间限制可能错过重要行情
- 止损设置过大可能导致单笔损失较高
风险控制建议: - 定期检查并优化参数设置 - 考虑加入波动率过滤器 - 实施更严格的资金管理规则 - 增加趋势确认的辅助指标
策略优化方向
- 引入自适应参数系统,根据市场状态动态调整指标参数
- 增加市场状态分类机制,在不同市场环境下使用不同的信号生成规则
- 优化时间过滤器设置,根据历史数据分析最佳交易时段
- 改进止损策略,考虑使用跟踪止损
- 加入市场情绪指标,提高信号质量
总结
该策略通过综合运用多个技术指标,构建了一个完整的交易系统。策略的优势在于多层指标交叉验证和严格的风险控制,但同时也面临参数优化和信号滞后等挑战。通过持续优化和改进,策略有望在不同市场环境下保持稳定表现。
策略源码
/*backtest
start: 2024-11-11 00:00:00
end: 2024-12-10 08:00:00
period: 2h
basePeriod: 2h
exchanges: [{"eid":"Futures_Binance","currency":"BTC_USDT"}]
*/

//@version=5
strategy("Khaleq Strategy Pro - Fixed Version", overlay=true)

// === Input Settings ===
ema_short = input.int(50, "EMA Short", minval=1)
ema_long = input.int(200, "EMA Long", minval=1)
adx_threshold = input.int(25, "ADX Threshold", minval=1)
atr_multiplier = input.float(2.0, "ATR Multiplier", minval=0.1)
time_filter_start = input(timestamp("0000-01-01 09:00:00"), "Trading Start Time", group="Time Filter")
time_filter_end = input(timestamp("0000-01-01 17:00:00"), "Trading End Time", group="Time Filter")

// === Ichimoku Settings ===
tenkan_len = 9
kijun_len = 26
senkou_span_b_len = 52
displacement = 26

// === Calculations ===
// Ichimoku Components
tenkan_sen = (ta.highest(high, tenkan_len) + ta.lowest(low, tenkan_len)) / 2
kijun_sen = (ta.highest(high, kijun_len) + ta.lowest(low, kijun_len)) / 2
senkou_span_a = (tenkan_sen + kijun_sen) / 2
senkou_span_b = (ta.highest(high, senkou_span_b_len) + ta.lowest(low, senkou_span_b_len)) / 2

// EMA Calculations
ema_short_val = ta.ema(close, ema_short)
ema_long_val = ta.ema(close, ema_long)

// Manual ADX Calculation
length = 14
dm_plus = math.max(ta.change(high), 0)
dm_minus = math.max(-ta.change(low), 0)
tr = math.max(high - low, math.max(math.abs(high - close[1]), math.abs(low - close[1])))
tr14 = ta.sma(tr, length)
dm_plus14 = ta.sma(dm_plus, length)
dm_minus14 = ta.sma(dm_minus, length)
di_plus = (dm_plus14 / tr14) * 100
di_minus = (dm_minus14 / tr14) * 100
dx = math.abs(di_plus - di_minus) / (di_plus + di_minus) * 100
adx_val = ta.sma(dx, length)

// ATR Calculation
atr_val = ta.atr(14)

// Stochastic RSI Calculation
k = ta.stoch(close, high, low, 14)
d = ta.sma(k, 3)

// Time Filter
is_within_time = true

// Support and Resistance (High and Low Levels)
resistance_level = ta.highest(high, 20)
support_level = ta.lowest(low, 20)

// Volume Analysis (On-Balance Volume)
vol_change = ta.change(close)
obv = ta.cum(vol_change > 0 ? volume : vol_change < 0 ? -volume : 0)

// === Signal Conditions ===
buy_signal = is_within_time and
             (close > ema_short_val) and
             (ema_short_val > ema_long_val) and
             (adx_val > adx_threshold) and
             (close > senkou_span_a) and
             (k < 20)  // Stochastic oversold

sell_signal = is_within_time and
              (close < ema_short_val) and
              (ema_short_val < ema_long_val) and
              (adx_val > adx_threshold) and
              (close < senkou_span_b) and
              (k > 80)  // Stochastic overbought

// === Plotting ===
// Plot Buy and Sell Signals
plotshape(buy_signal, color=color.green, style=shape.labelup, title="Buy Signal", location=location.belowbar, text="BUY")
plotshape(sell_signal, color=color.red, style=shape.labeldown, title="Sell Signal", location=location.abovebar, text="SELL")

// Plot EMAs
plot(ema_short_val, color=color.blue, title="EMA Short")
plot(ema_long_val, color=color.orange, title="EMA Long")

// Plot Ichimoku Components
plot(senkou_span_a, color=color.green, title="Senkou Span A", offset=displacement)
plot(senkou_span_b, color=color.red, title="Senkou Span B", offset=displacement)

// // Plot Support and Resistance using lines
// var line resistance_line = na
// var line support_line = na
// if bar_index > 1
//     line.delete(resistance_line)
//     line.delete(support_line)
// resistance_line := line.new(x1=bar_index - 1, y1=resistance_level, x2=bar_index, y2=resistance_level, color=color.red, width=1, style=line.style_dotted)
// support_line := line.new(x1=bar_index - 1, y1=support_level, x2=bar_index, y2=support_level, color=color.green, width=1, style=line.style_dotted)

// Plot OBV
plot(obv, color=color.purple, title="OBV")

// Plot Background for Trend (Bullish/Bearish)
bgcolor(close > ema_long_val ? color.new(color.green, 90) : color.new(color.red, 90), title="Trend Background")

// === Alerts ===
alertcondition(buy_signal, title="Buy Alert", message="Buy Signal Triggered")
alertcondition(sell_signal, title="Sell Alert", message="Sell Signal Triggered")

// === Strategy Execution ===
if buy_signal
    strategy.entry("Buy", strategy.long)

if sell_signal
    strategy.close("Buy")
    strategy.exit("Sell", "Buy", stop=close - atr_multiplier * atr_val, limit=close + atr_multiplier * atr_val)
相关推荐