Dynamic ATR Trend Following Strategy Based on Support Breakout

1
Follow
1781
Followers
Overview
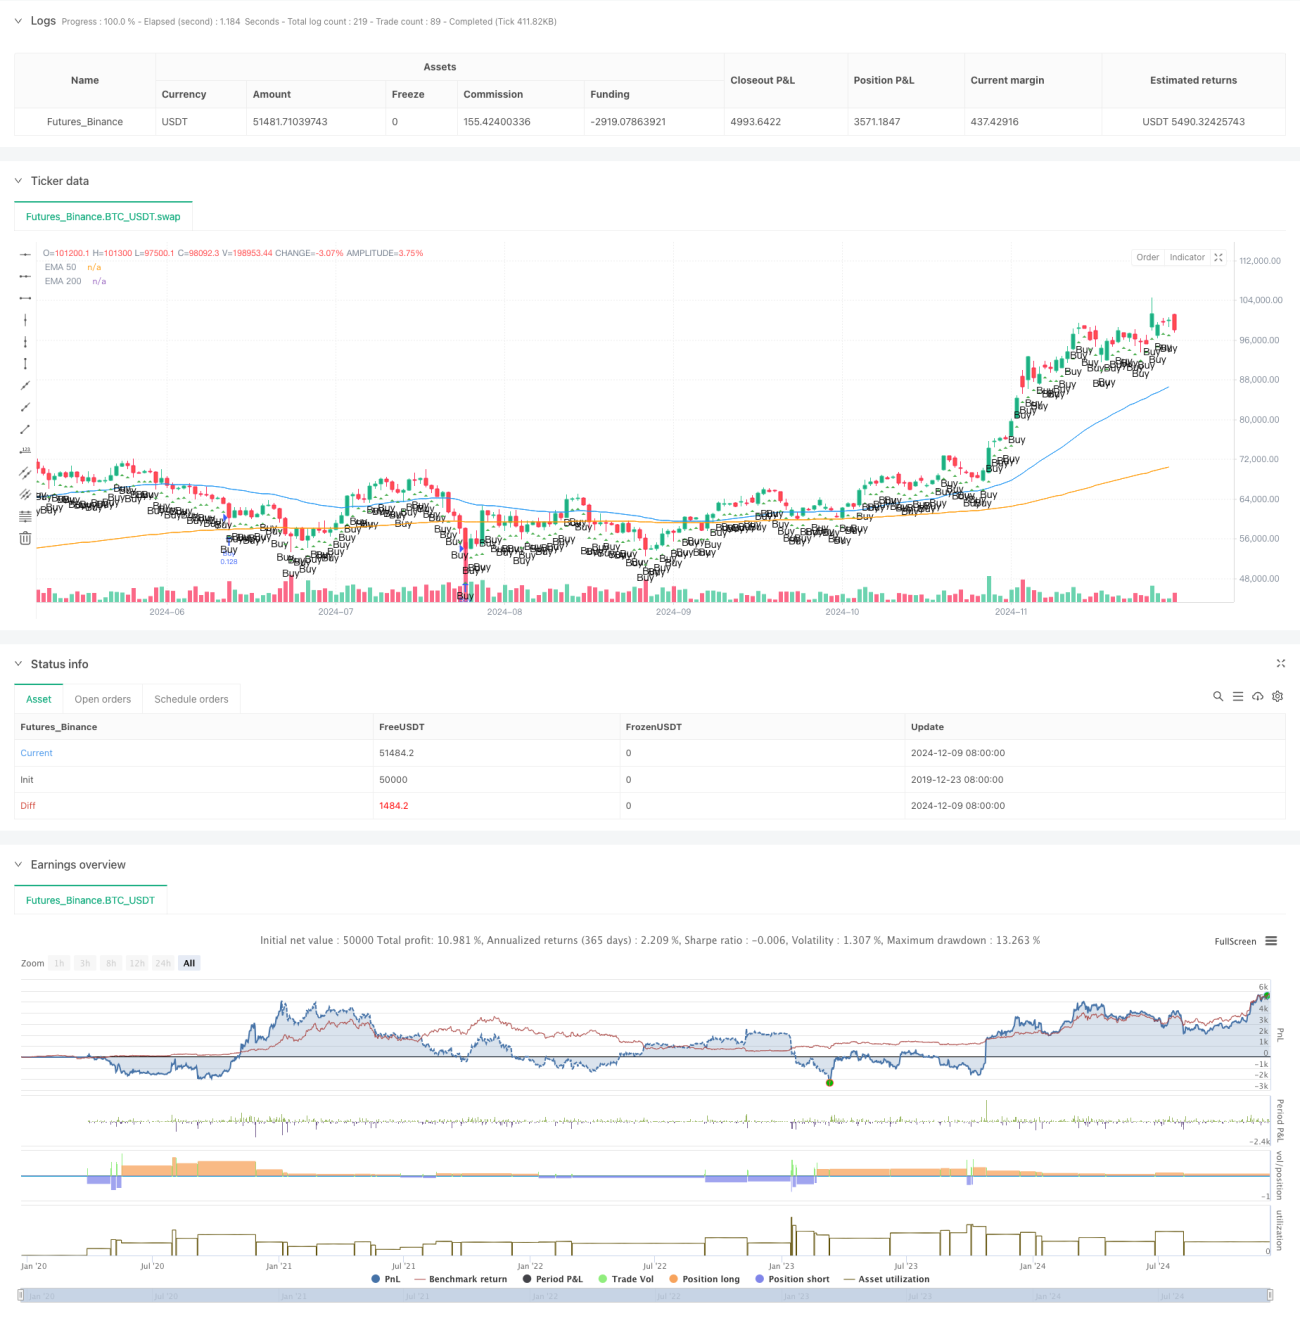
This is a dynamic ATR trend following strategy based on support breakout. The strategy incorporates EMA system, ATR volatility indicator, and Smart Money Concept (SMC) to capture market trends. It achieves effective risk management through dynamic position sizing and stop-loss/take-profit placement.
Strategy Principle
The strategy is built on several core components:
- Uses 50 and 200-period EMA system to confirm market trend direction
- Utilizes ATR indicator to dynamically adjust stop-loss and profit targets
- Analyzes Order Blocks and Imbalance Zones to find optimal entry points
- Automatically calculates position size based on account risk percentage
- Determines market consolidation by observing price range of last 20 candles
Strategy Advantages
- Comprehensive risk management through dynamic calculation
- Reliable trend identification system that avoids consolidation markets
- Reasonable stop-loss and take-profit settings with 1:3 risk-reward ratio
- Adapts well to different market conditions
- Clear code structure that's easy to maintain and optimize
Strategy Risks
- EMA indicators have inherent lag, potentially delaying entry points
- May generate false signals in highly volatile markets
- Strategy depends on trend continuation, may underperform in ranging markets
- Wide stop-loss placement may lead to larger losses in certain situations
Optimization Directions
- Incorporate volume-price relationship analysis to improve trend identification
- Add market sentiment indicators to optimize entry timing
- Consider multiple timeframe analysis to enhance system stability
- Refine Order Block and Imbalance Zone identification criteria
- Optimize stop-loss method, consider implementing trailing stops
Summary
This strategy is a comprehensive trend following system that achieves trading stability through proper risk management and multiple signal confirmation. Despite some lag in signals, it represents a reliable trading system overall. It's recommended to conduct thorough backtesting before live implementation and optimize parameters according to specific trading instruments and market conditions.
Source
Pine
/*backtest
start: 2019-12-23 08:00:00
end: 2024-12-10 08:00:00
period: 1d
basePeriod: 1d
exchanges: [{"eid":"Futures_Binance","currency":"BTC_USDT"}]
*/

// TradingView Pine Script strategy for Smart Money Concept (SMC)
//@version=5
strategy("Smart Money Concept Strategy", overlay=true, default_qty_type=strategy.fixed, default_qty_value=100)
Strategy parameters
Related strategies
Comment
All comments (0)
No data
- 1