概述
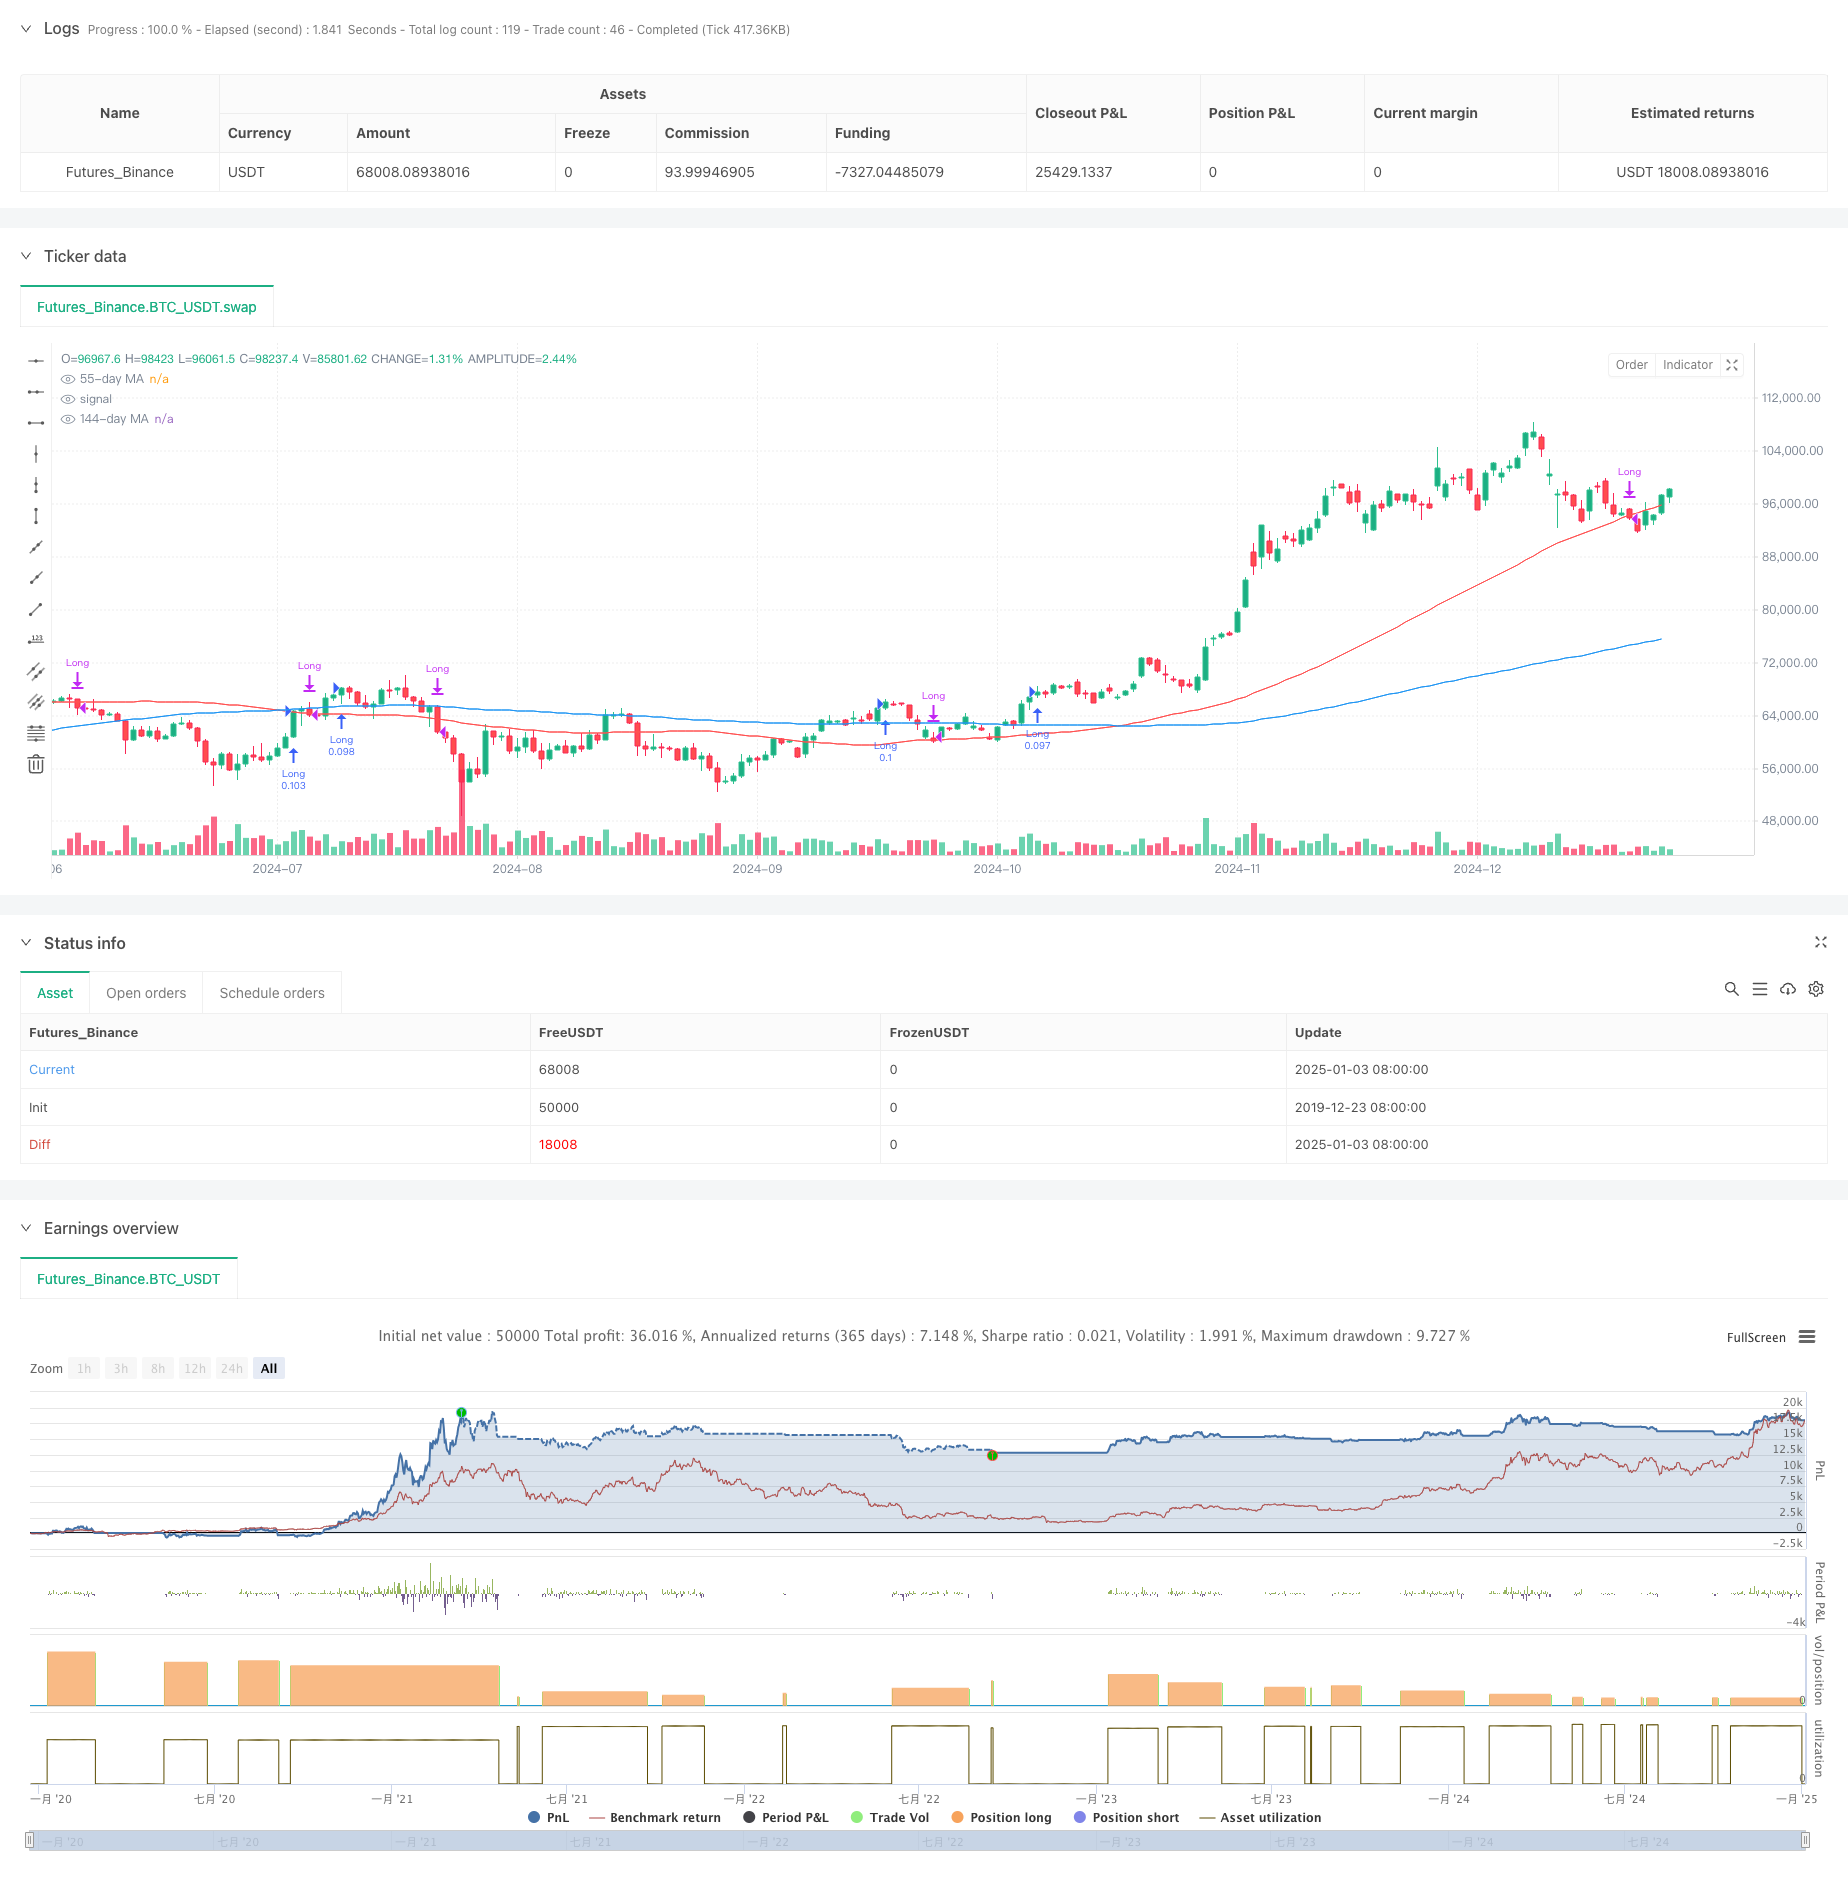
该策略是一个基于相对强弱指数(RSI)、移动平均线(MA)和价格动量的综合交易系统。策略主要通过监测RSI趋势变化、多重时间周期的移动平均线交叉以及价格动量的变化来识别潜在的交易机会。该策略特别关注RSI的上升趋势和价格的连续上涨态势,通过多重确认来提高交易的准确性。
策略原理
策略的核心逻辑基于以下几个关键组件: 1. RSI趋势分析:使用13周期的RSI指标和其移动平均线来确认价格强度 2. 价格动量确认:要求连续3个更高高点(Higher Highs)形成,验证上涨趋势的持续性 3. 多重移动平均线系统:采用21日、55日和144日移动平均线作为趋势过滤器 4. 资金管理:每次交易使用账户权益的10%进行仓位控制 买入条件需满足:RSI大于其平均值、价格形成连续更高高点、RSI保持上升趋势 卖出条件包括:价格跌破55日均线或RSI跌破均值且价格跌破55日均线
策略优势
- 多重确认机制:通过RSI、价格动量和均线系统的多重验证,提高交易信号的可靠性
- 趋势跟踪能力:策略能够有效捕捉中长期趋势,避免假突破
- 风险控制完善:通过仓位管理和明确的止损条件来控制风险
- 适应性强:可以应用于不同的时间周期和市场环境
- 资金管理合理:采用账户权益百分比进行仓位控制,避免固定仓位的风险
策略风险
- 滞后性风险:移动平均线和RSI指标本身具有一定滞后性,可能导致入场和出场时机略有延迟
- 震荡市场风险:在横盘震荡市场中可能产生频繁的假信号
- 连续亏损风险:在市场突变时期可能面临连续的止损 解决方案:
- 增加市场环境过滤器
- 优化指标参数
- 引入波动率自适应机制
策略优化方向
- 指标参数优化:
- 考虑使用自适应的RSI周期
- 根据不同市场周期调整移动平均线参数
- 增加市场环境识别:
- 引入波动率指标
- 添加趋势强度过滤器
- 完善风险控制:
- 实现动态止损机制
- 增加盈利目标管理
- 优化仓位管理:
- 根据信号强度调整仓位大小
- 实现分批建仓和减仓机制
总结
该策略通过综合运用技术分析指标和动量分析方法,构建了一个相对完整的交易系统。策略的优势在于其多重确认机制和完善的风险控制,但仍需要注意市场环境的适应性和参数优化问题。通过持续优化和改进,该策略有潜力成为一个稳健的交易系统。
策略源码
/*backtest
start: 2019-12-23 08:00:00
end: 2025-01-04 08:00:00
period: 1d
basePeriod: 1d
exchanges: [{"eid":"Futures_Binance","currency":"BTC_USDT"}]
*/

//@version=5
strategy("Improved Strategy with RSI Trending Upwards", overlay=true)

// Inputs for moving averages
ma21_length = input.int(21, title="21-day MA Length")
ma55_length = input.int(55, title="55-day MA Length")
ma144_length = input.int(144, title="144-day MA Length")

// Moving averages
ma21 = ta.sma(close, ma21_length)
ma55 = ta.sma(close, ma55_length)
ma144 = ta.sma(close, ma144_length)

// RSI settings
rsi_length = input.int(13, title="RSI Length")
rsi_avg_length = input.int(13, title="RSI Average Length")
rsi = ta.rsi(close, rsi_length)
rsi_avg = ta.sma(rsi, rsi_avg_length)

// RSI breakout condition
rsi_breakout = ta.crossover(rsi, rsi_avg)

// RSI trending upwards
rsi_trending_up = rsi > rsi[1] and rsi[1] > rsi[2]

// Higher high condition
hh1 = high[2] > high[3]  // 1st higher high
hh2 = high[1] > high[2]  // 2nd higher high
hh3 = high > high[1]     // 3rd higher high
higher_high_condition = hh1 and hh2 and hh3

// Filter for trades starting after 1st January 2007
date_filter = (year >= 2007 and month >= 1 and dayofmonth >= 1)

// Combine conditions for buying
buy_condition = rsi > rsi_avg and higher_high_condition and rsi_trending_up //and close > ma21 and ma21 > ma55
// buy_condition = rsi > rsi_avg and rsi_trending_up

// Sell condition
// Sell condition: Close below 21-day MA for 3 consecutive days
downtrend_condition = close < close[1] and close[1] < close[2] and close[2] < close[3] and close[3] < close[4] and close[4] < close[5]
// downtrend_condition = close < close[1] and close[1] < close[2] and close[2] < close[3]

sell_condition_ma21 = close < ma55 and close[1] < ma55 and close[2] < ma55 and close[3] < ma55 and close[4] < ma55 and downtrend_condition

// Final sell condition
sell_condition = ta.crossunder(close, ma55) or (ta.crossunder(rsi, rsi_avg) and ta.crossunder(close, ma55))

// Execute trades
if (buy_condition and date_filter)
    // strategy.entry("Long", strategy.long, comment="Buy")
    strategy.entry("Long", strategy.long, qty=strategy.equity * 0.1 / close)
if (sell_condition and date_filter)
    strategy.close("Long", comment="Sell")

// Plot moving averages
plot(ma55, color=color.red, title="55-day MA")
plot(ma144, color=color.blue, title="144-day MA")
相关推荐