Dynamic Support and Resistance Adaptive Pivot Trading Strategy

Overview
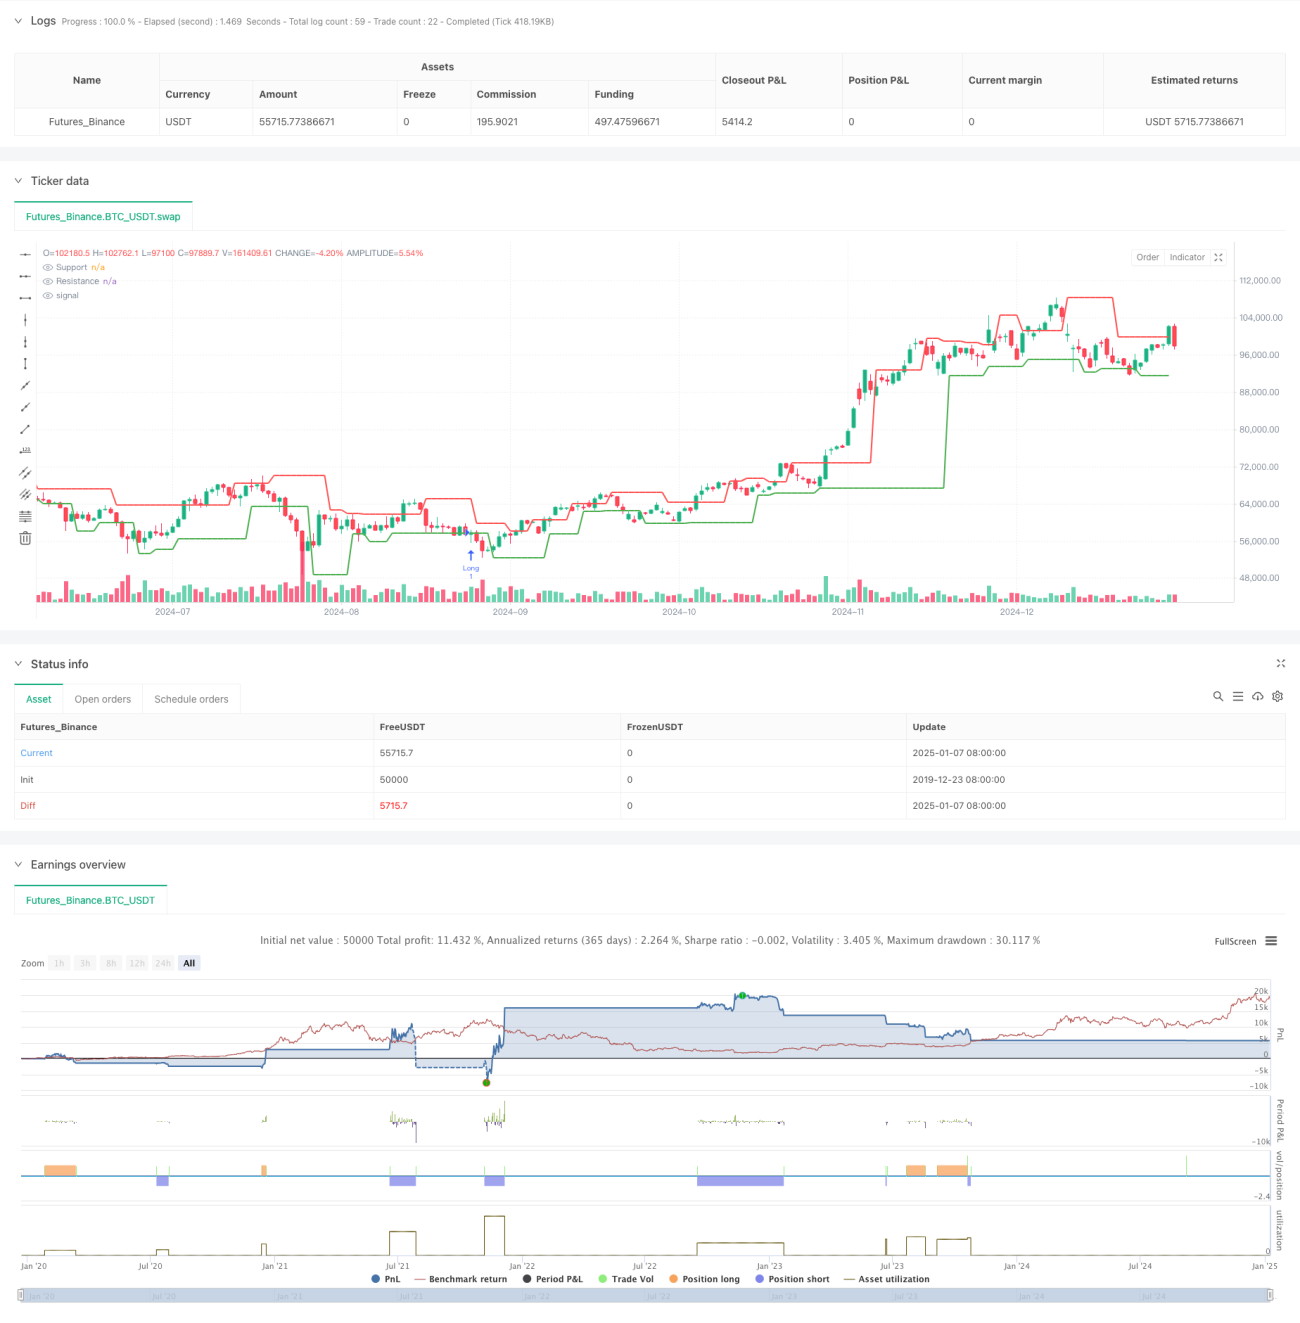
This strategy is an adaptive trading system based on dynamic identification of support and resistance levels using price pivot points. It determines key price levels by calculating local highs and lows in real-time and executes trades accordingly. The core strength lies in its dynamic nature, allowing it to adjust trading parameters based on changing market conditions, making it suitable for both trending and ranging markets.
Strategy Principles
The core logic is based on several key elements:
- Dynamic pivot calculation: Uses adjustable pivot length parameter (default 2) to identify local highs and lows
- Support/resistance zones: Establishes percentage-based ranges (default 0.4%) around pivot points to define valid trading areas
- Signal generation: Long signals when price breaks above support, short signals when price breaks below resistance
- Risk management: Implements dynamic stop-loss (10%) and take-profit (27%) levels, with position sizing based on account equity
Strategy Advantages
- High adaptability: Dynamically adjusts support/resistance levels based on market conditions, avoiding lag from static levels
- Controlled risk: Maintains reasonable risk per trade through strict percentage-based stops and dynamic position sizing
- Scalability: Supports multiple timeframes and parameter combinations for optimization across different market environments
- Transparency: Clear trading logic with all signals and price levels visually displayed on charts
Strategy Risks
- False breakout risk: May generate frequent false signals in ranging markets, requiring adjustment of support/resistance zone parameters
- Slippage impact: Actual execution prices may differ significantly from signal prices in less liquid market conditions
- Trend dependency: Strategy performs better in trending markets but may generate excessive signals during consolidation phases
- Parameter sensitivity: Performance highly dependent on parameter settings, requiring thorough backtesting for optimization
Optimization Directions
- Add market environment recognition module for automatic parameter adjustment based on volatility
- Incorporate volume and additional technical indicators as confirmation signals
- Optimize position sizing algorithm with dynamic adjustments based on market volatility
- Implement time filters to avoid trading during unfavorable periods
- Develop adaptive stop-loss algorithm with dynamic adjustment based on market volatility
Summary
The strategy provides a reliable framework for trend-following and reversal trading through dynamic identification of key price levels combined with strict risk control. While it exhibits some parameter sensitivity and market environment dependency, continuous optimization and refinement enable consistent performance across different market conditions. Successful implementation requires traders to deeply understand its principles and adjust parameters according to specific market situations.
/*backtest
start: 2019-12-23 08:00:00
end: 2025-01-08 08:00:00
period: 1d
basePeriod: 1d
exchanges: [{"eid":"Futures_Binance","currency":"BTC_USDT"}]
*/

// This Pine Script™ code is subject to the terms of the Mozilla Public License 2.0 at https://mozilla.org/MPL/2.0/
// © felipemiransan

//@version=6- 1