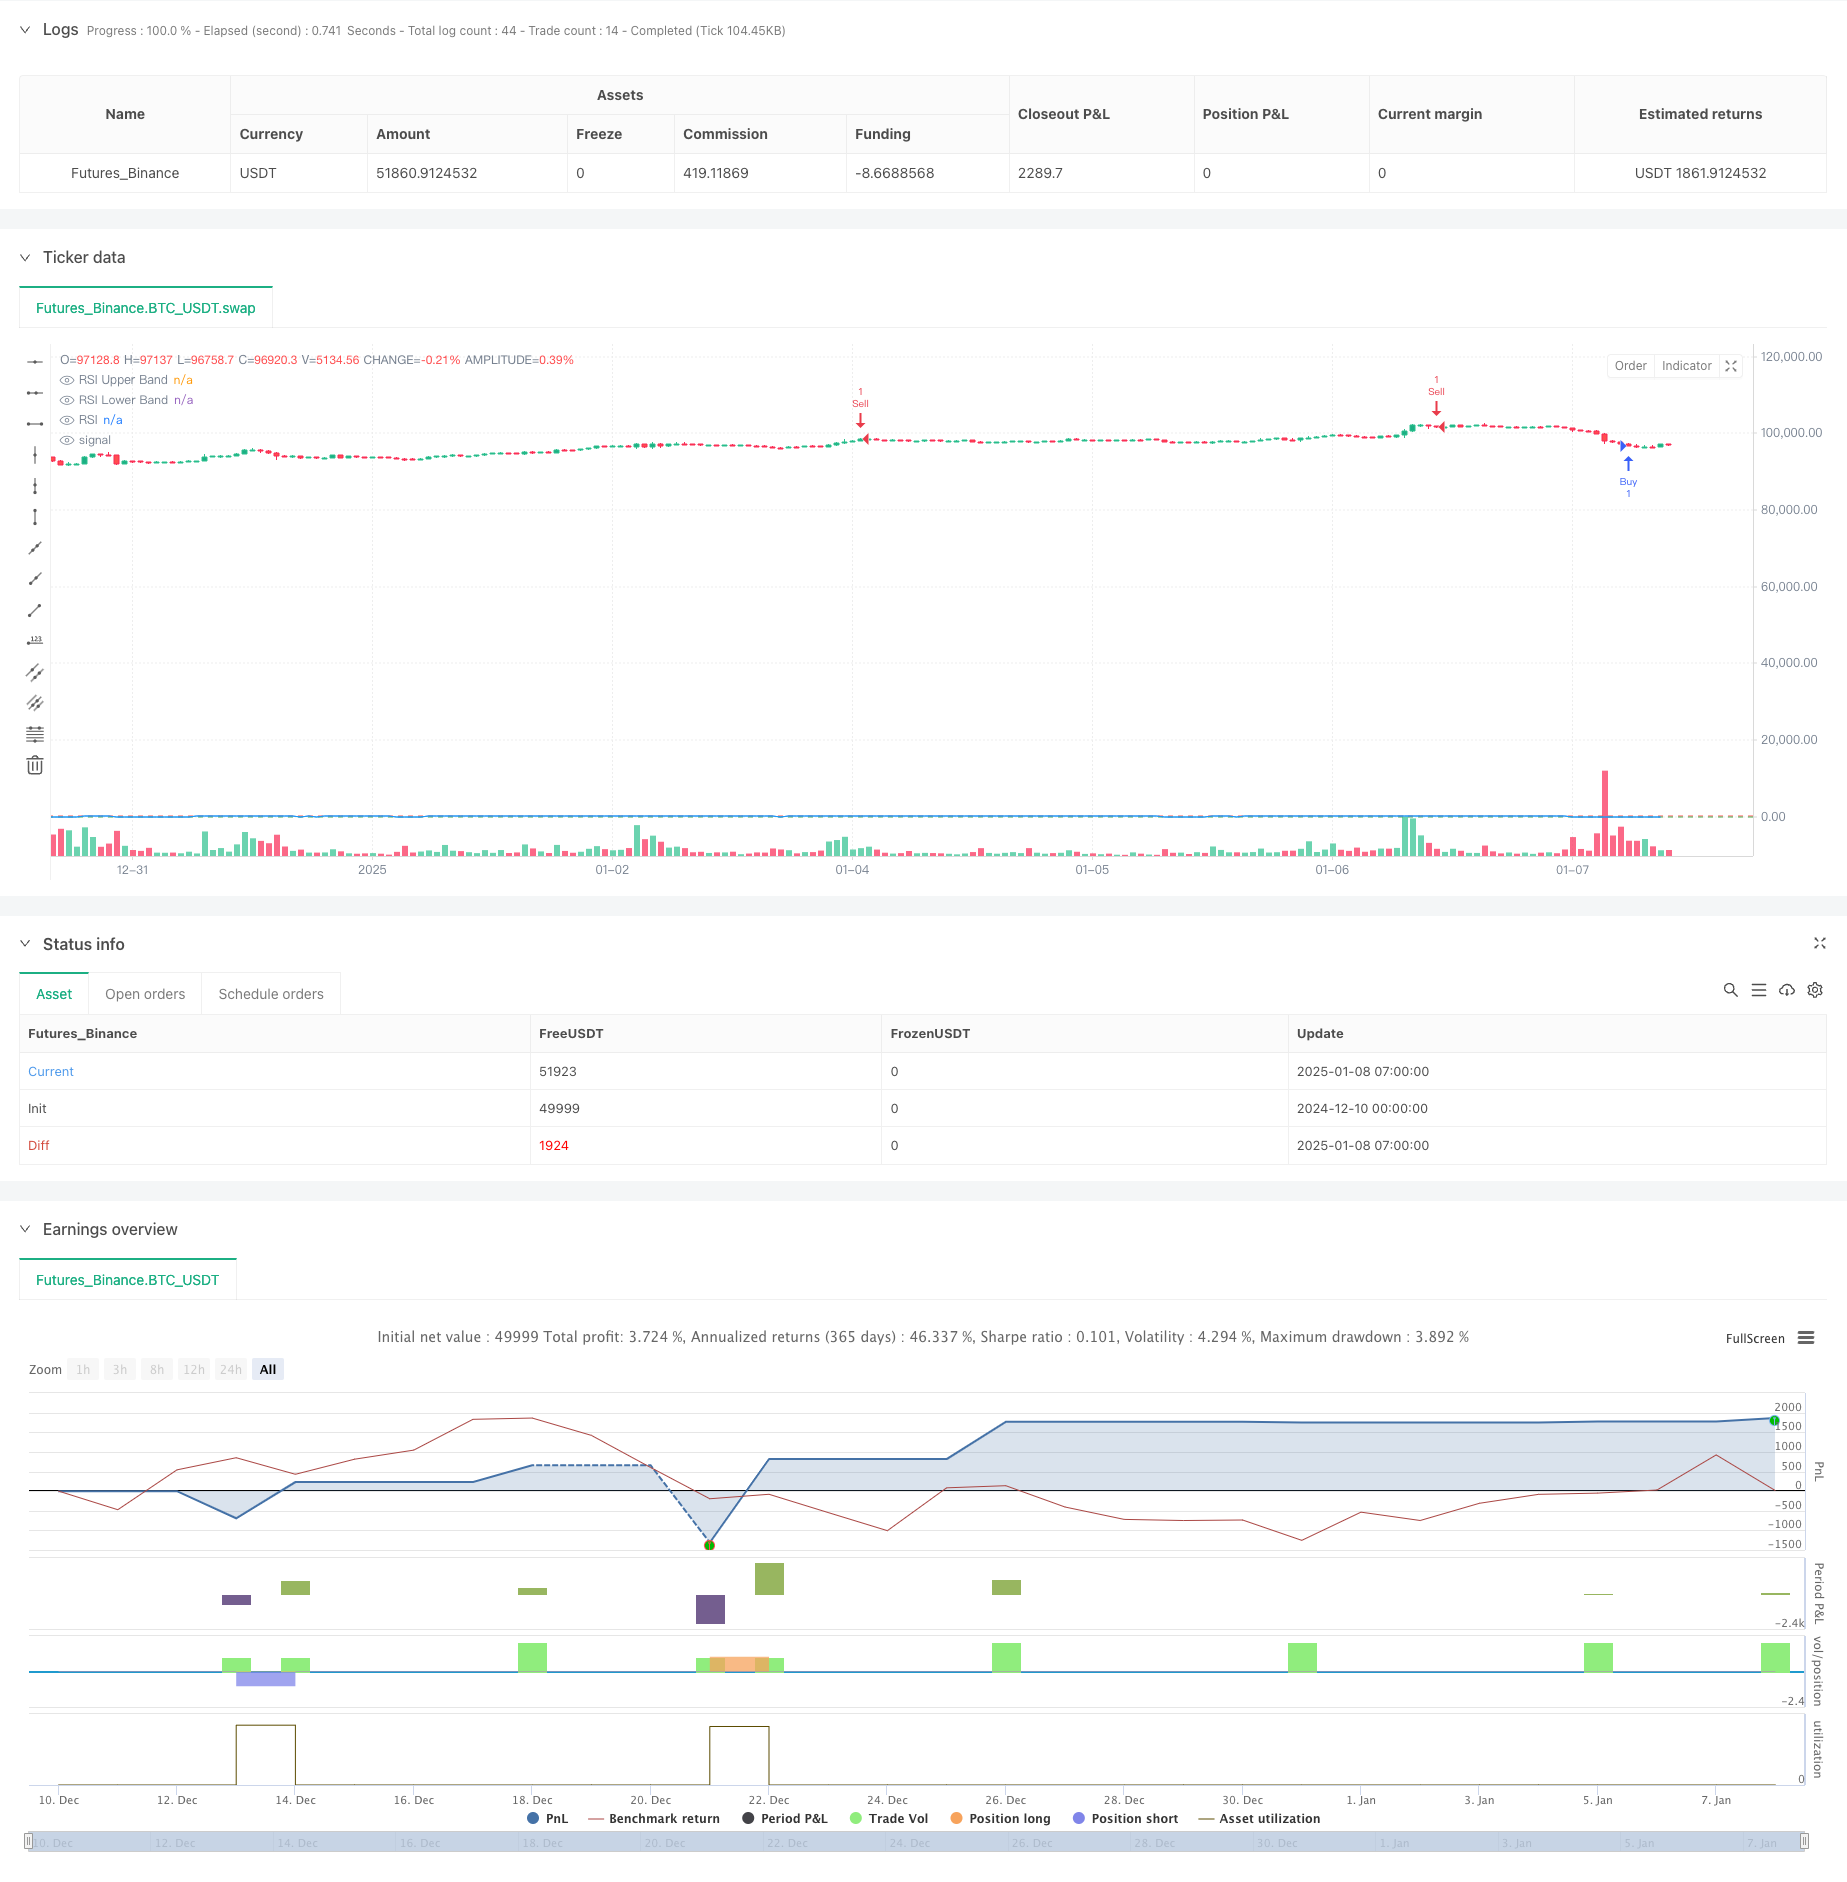
概述
本策略是一个基于相对强弱指数(RSI)的多级指标叠加交易系统。策略在特定的交易时间窗口内运行,通过RSI指标的超买超卖信号来识别交易机会,并结合仓位动态调整机制,在市场逆向运动时采用分批建仓方式来优化整体收益。策略采用基于平均入场价格的目标获利方式进行止盈管理。
策略原理
策略主要基于以下几个核心组件运作: 1. RSI指标计算采用标准14周期,使用收盘价作为计算源数据 2. 交易时间窗口控制在2-4小时之间,可根据市场特点灵活调整 3. 入场信号基于RSI低于30的超卖和高于70的超买水平 4. 建仓机制包含初始仓位和动态调整仓位两个层次 5. 当价格向不利方向移动超过1个点时触发加仓机制 6. 止盈设置在平均建仓价格基础上浮动1.5个点
策略优势
- 多层次信号过滤:结合RSI技术指标和时间窗口双重过滤,有效降低虚假信号
- 动态仓位管理:通过分批建仓机制,在市场逆向运动时降低平均成本
- 风险收益比合理:止盈点位设置基于平均建仓价格,确保整体交易的预期收益
- 策略逻辑清晰:各个模块职责明确,便于后续优化和调整
- 适应性强:关键参数均可根据不同市场特点进行优化调整
策略风险
- 趋势市场风险:在强趋势市场中可能面临频繁加仓导致的资金占用过大
- 时间窗口限制:特定时间窗口的限制可能错过其他时段的良好机会
- 参数敏感性:RSI周期、建仓间距等参数的设置对策略表现影响较大
- 资金管理风险:需要合理控制单次建仓比例,避免资金过度集中
策略优化方向
- 引入趋势过滤器:建议添加移动平均线等趋势指标,优化入场时机
- 动态参数优化:可基于市场波动率动态调整RSI阈值和建仓间距
- 完善止损机制:建议增加跟踪止损功能,更好地保护既有利润
- 优化时间窗口:可通过回测数据分析,找出更优的交易时间段
- 增加成交量指标:结合成交量分析,提高信号可靠性
总结
该策略通过RSI指标与分批建仓机制的结合,形成了一个较为完整的交易系统。策略的核心优势在于其多层次的信号过滤机制和灵活的仓位管理方式,但同时也需要注意趋势市场风险和参数优化等问题。通过添加趋势过滤器、优化止损机制等方向的改进,策略的整体表现还有提升空间。
策略源码
/*backtest
start: 2024-12-10 00:00:00
end: 2025-01-08 08:00:00
period: 1h
basePeriod: 1h
exchanges: [{"eid":"Futures_Binance","currency":"BTC_USDT","balance":49999}]
*/

//@version=6
strategy("TonyM RSI", overlay=true)

// Input Settings
rsiLengthInput = input.int(14, minval=1, title="RSI Length", group="RSI Settings")
rsiSourceInput = input.source(close, "Source", group="RSI Settings")
startHour = input.int(2, "Start Hour", minval=0, maxval=23, group="Trading Window")
endHour = input.int(4, "End Hour", minval=0, maxval=23, group="Trading Window")

// RSI Calculation
change = ta.change(rsiSourceInput)
up = ta.rma(math.max(change, 0), rsiLengthInput)
down = ta.rma(-math.min(change, 0), rsiLengthInput)
rsi = down == 0 ? 100 : up == 0 ? 0 : 100 - (100 / (1 + up / down))

// Time Filter
inTradingWindow = (hour >= startHour and hour < endHour)

// Strategy Settings
buyLevel = 30
sellLevel = 70
scaleDistance = 1.0  // Distance in points to add to the position
takeProfitPoints = 1.5  // Profit target from average price
initialQty = 1  // Initial trade size
scalingQty = 1  // Additional trade size for scaling

// Trade Logic
if inTradingWindow
    // Entry Logic
    if rsi <= buyLevel and strategy.position_size == 0
        strategy.entry("Buy", strategy.long, qty=initialQty)
    if rsi >= sellLevel and strategy.position_size == 0
        strategy.entry("Sell", strategy.short, qty=initialQty)

    // Scaling Logic
    if strategy.position_size > 0 and close <= strategy.position_avg_price - scaleDistance
        strategy.entry("Scale Buy", strategy.long, qty=scalingQty)
    if strategy.position_size < 0 and close >= strategy.position_avg_price + scaleDistance
        strategy.entry("Scale Sell", strategy.short, qty=scalingQty)

    // Exit Logic (based on average price)
    if strategy.position_size > 0
        strategy.exit("Take Profit Long", "Buy", limit=strategy.position_avg_price + takeProfitPoints)
    if strategy.position_size < 0
        strategy.exit("Take Profit Short", "Sell", limit=strategy.position_avg_price - takeProfitPoints)

// Plot RSI
plot(rsi, "RSI", color=color.blue, linewidth=1)
rsiUpperBand = hline(70, "RSI Upper Band", color=color.red)
rsiLowerBand = hline(30, "RSI Lower Band", color=color.green)
fill(rsiUpperBand, rsiLowerBand, color=color.new(color.gray, 90))
相关推荐