
Overview
This strategy is a comprehensive trading system based on Keltner Channels and dynamic support/resistance levels. It analyzes multiple timeframes, combining moving averages and volatility indicators to form a complete trading decision framework. The core approach is to identify price breakout opportunities while considering market trends and volatility to capture high-probability trading opportunities.
Strategy Principles
The strategy employs a multi-layer technical indicator system:
- Uses 21-period Keltner Channels as the primary trend identification tool, with channel width determined by ATR
- Calculates key support/resistance levels using 21 left-side and 8 right-side bars
- Incorporates higher timeframe moving averages as trend filters
- Combines short-term (5-period) and long-term (30-period) moving averages for entry timing
- Uses ATR for dynamic stop-loss adjustment
Strategy Advantages
- Multi-dimensional technical indicators provide mutual verification, reducing false signals
- Dynamic support/resistance levels update in real-time, adapting to market changes
- Higher timeframe analysis filters out secondary market movements
- Flexible stop-loss parameters based on different timeframes
- Percentage-based position management for effective risk control
Strategy Risks
- May generate frequent trading signals in ranging markets
- Multiple indicator verification might miss some trading opportunities
- Parameter optimization poses overfitting risks
- Stop-loss levels may be too wide in high-volatility environments
- Support/resistance levels may fail during rapid market changes
Optimization Directions
- Incorporate volume indicators to validate breakouts
- Add market volatility analysis module for dynamic parameter adjustment
- Improve support/resistance calculation methods for better accuracy
- Add trend strength assessment to refine entry conditions
- Enhance position management system for more precise risk control
Summary
This is a well-structured and logically rigorous quantitative trading strategy. Through the coordinated use of multiple technical indicators, it ensures both reliable trading signals and effective risk control. The strategy's strong extensibility allows for continuous optimization and improvement, potentially maintaining stable performance across different market environments.
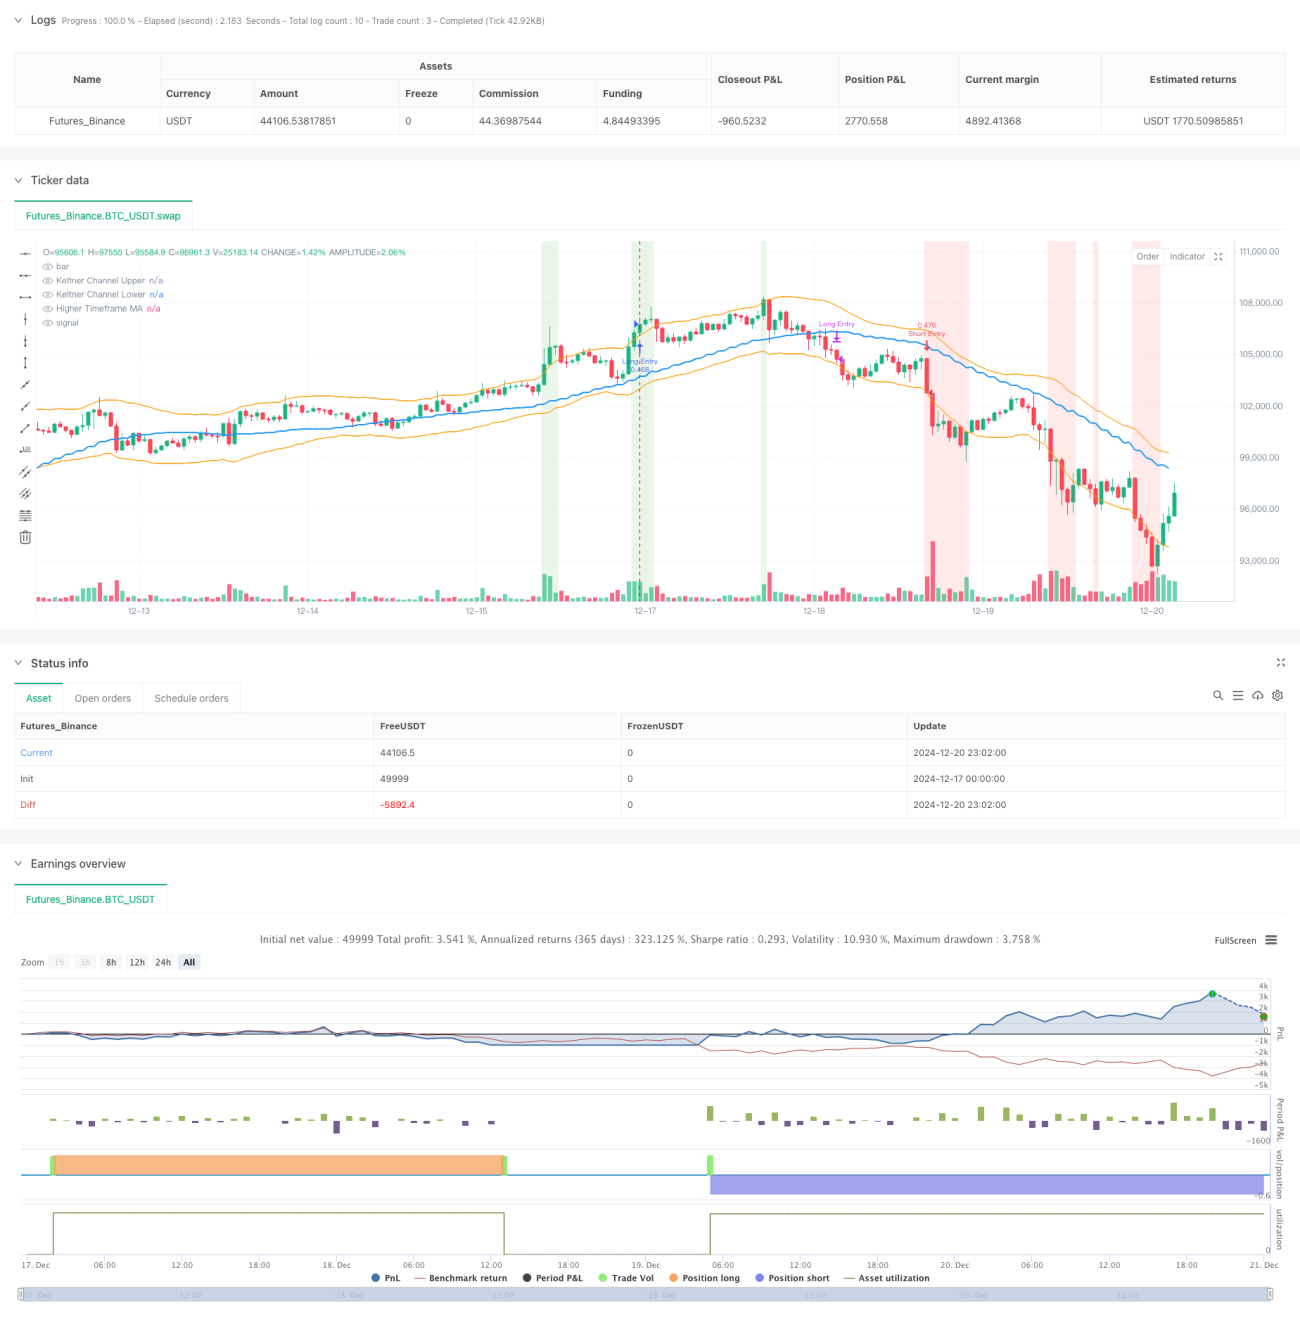
/*backtest
start: 2024-12-17 00:00:00
end: 2024-12-21 00:00:00
period: 1h
basePeriod: 1h
exchanges: [{"eid":"Futures_Binance","currency":"BTC_USDT","balance":49999}]
*/

// This Pine Script™ code is subject to the terms of the Mozilla Public License 2.0 at https://mozilla.org/MPL/2.0/
// © sathcm
//@version=5
strategy("KMS", overlay=true, initial_capital=100000, default_qty_type=strategy.percent_of_equity, default_qty_value=100, commission_type=strategy.commission.percent, commission_value=0.05, slippage=3)- 1