
Overview
This strategy is a comprehensive trend-following system that integrates multiple technical indicators, including Exponential Moving Averages (EMA), Relative Strength Index (RSI), Moving Average Convergence Divergence (MACD), and Bollinger Bands (BB). The strategy incorporates dynamic risk management with percentage-based stop-loss and risk-reward ratio-based take-profit levels, aiming to achieve stable risk-adjusted returns.
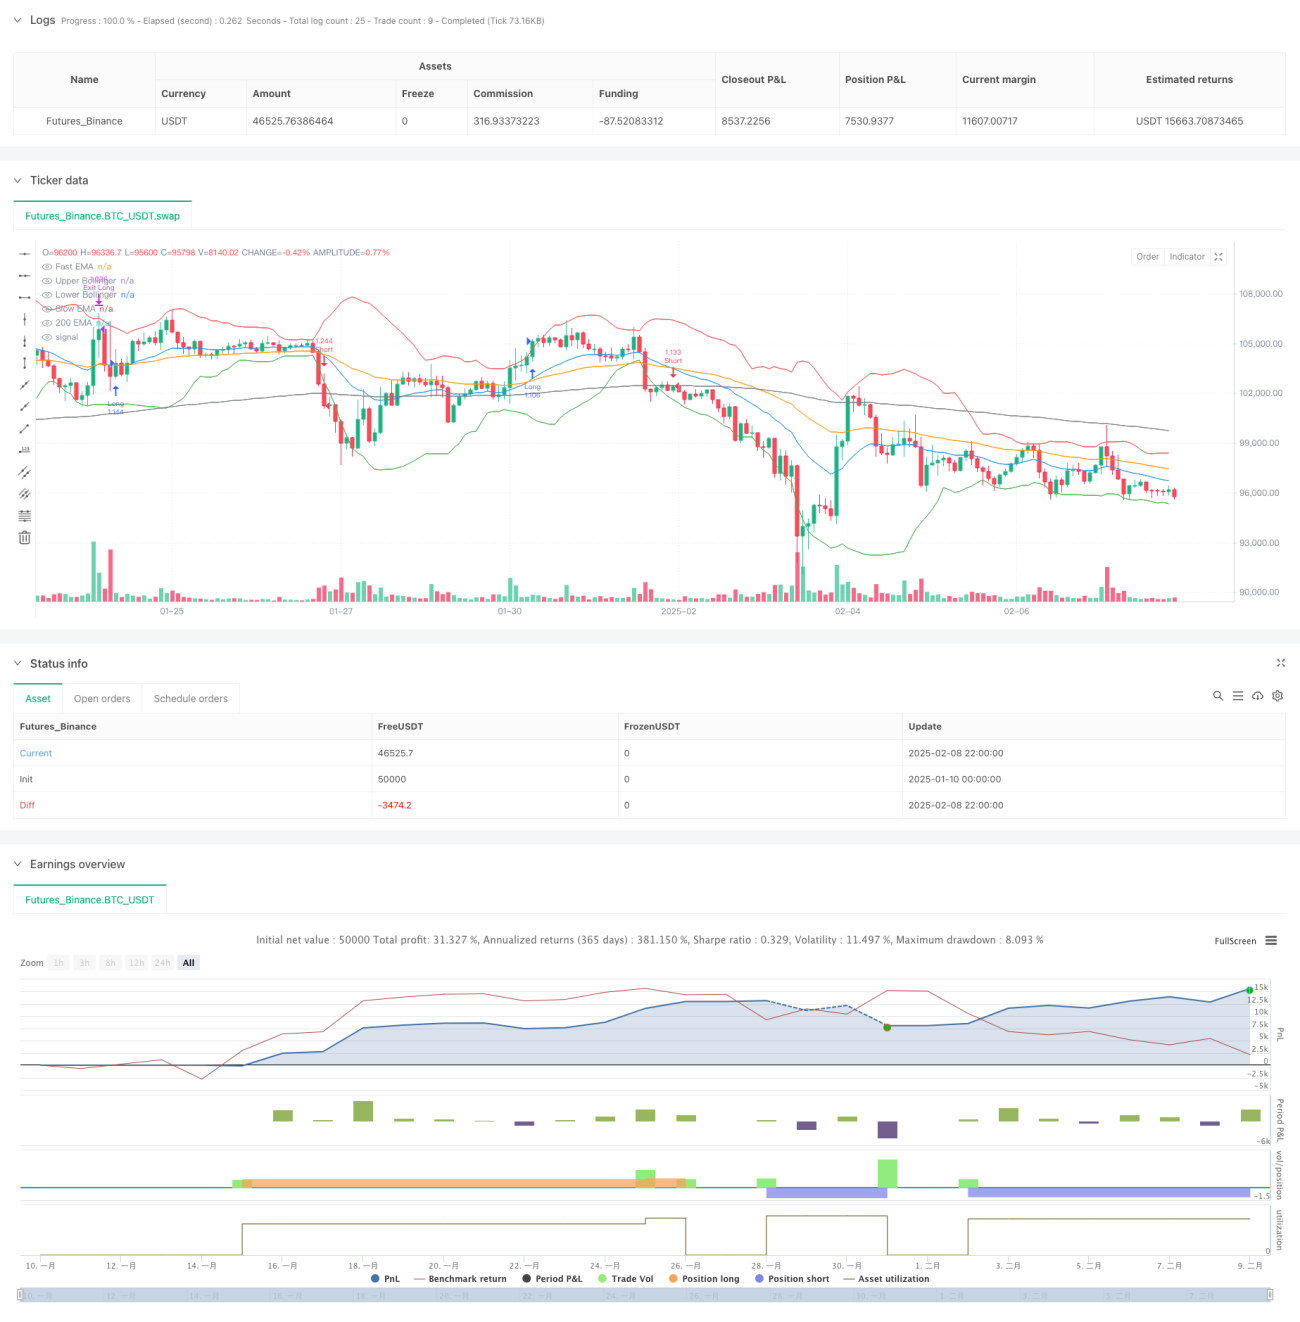
Strategy Principles
The core logic is based on multi-dimensional market analysis:
- Trend Confirmation: Uses 200-day EMA for long-term trend direction, with fast EMA (20-day) and slow EMA (50-day) crossovers confirming medium-term trend changes
- Momentum Verification: Employs dual confirmation with RSI and MACD, requiring RSI above 50 (long) or below 50 (short), along with supporting MACD signal line direction
- Volatility Control: Utilizes Bollinger Bands for precise entry timing, seeking long opportunities at lower band support and short opportunities at upper band resistance
- Risk Management: Implements 2% stop-loss and 1.5x risk-reward ratio take-profit levels to ensure controlled risk per trade
Strategy Advantages
- Multi-dimensional Analysis: Combines trend, momentum, and volatility indicators to reduce false signals
- Comprehensive Risk Control: Preset stop-loss and take-profit levels ensure risk manageability
- High Adaptability: Strategy parameters can be adjusted for different market conditions
- Clear Execution: Entry and exit conditions are well-defined and easy to monitor
- Sound Money Management: Uses account equity percentage for position sizing to avoid excessive risk
Strategy Risks
- Market Volatility Risk: May trigger frequent stop-losses during high volatility periods
- Trend Reversal Risk: Potential for significant drawdowns at trend turning points
- Parameter Optimization Risk: Over-optimization may lead to overfitting
- Execution Slippage Risk: May face significant slippage in low liquidity conditions
- Commission Cost Risk: Frequent trading may incur high transaction costs
Strategy Optimization Directions
- Dynamic Parameter Adjustment: Automatically adjust indicator parameters based on market volatility
- Add Market Sentiment Indicators: Incorporate volume indicators to enhance signal reliability
- Optimize Stop-Loss Mechanism: Implement trailing stops to improve profit protection
- Introduce Time Filters: Add trading time window filtering
- Add Volatility Filters: Reduce position size or pause trading during excessive volatility
Summary
This strategy establishes a complete trend-following trading system through the comprehensive use of multiple technical indicators. With strict risk management and multi-dimensional market analysis, the strategy demonstrates good adaptability and stability. While there is room for optimization, the overall framework design is sound and suitable as a foundation for medium to long-term trading strategies. Successful implementation requires continuous monitoring and timely parameter adjustments to adapt to different market conditions.
/*backtest
start: 2025-01-10 00:00:00
end: 2025-02-09 00:00:00
period: 2h
basePeriod: 2h
exchanges: [{"eid":"Futures_Binance","currency":"BTC_USDT"}]
*/

//@version=5
strategy("Altcoin Long/Short Strategy", overlay=true, initial_capital=1000, default_qty_type=strategy.percent_of_equity, default_qty_value=200, commission_type=strategy.commission.percent, commission_value=0.1)

// —————— Inputs ——————- 1