Trend Momentum Strategy - Multi-Period Dynamic ZigZag Wave Timing System

Overview
This strategy is a multi-dimensional trading system that combines the ZigZag indicator with the Williams %R indicator. It identifies significant swing highs and lows using the ZigZag indicator while confirming entry points with the Williams %R when the market reaches overbought or oversold conditions. This combination captures major market trend reversals while using momentum confirmation to improve trading accuracy.
Strategy Principles
The core logic is based on two main components:
- The ZigZag indicator identifies significant swing points using depth and deviation parameters to filter market noise and determine trend direction. A new swing low indicates the start of an uptrend, while a new swing high indicates the start of a downtrend.
- The Williams %R indicator calculates market momentum by comparing current price to the highest price within a specific period. Values crossing above -80 indicate oversold conditions (potential buy), while crossing below -20 indicate overbought conditions (potential sell).
Trading rules are as follows:
- Long Entry: ZigZag identifies a new swing low and Williams %R crosses up from oversold zone
- Short Entry: ZigZag identifies a new swing high and Williams %R crosses down from overbought zone
- Stop Loss is set at 1% and Take Profit at 2%
Strategy Advantages
- Multi-dimensional confirmation: Improved signal reliability through trend and momentum verification
- Strong adaptability: ZigZag deviation parameters can be dynamically adjusted based on market volatility
- Comprehensive risk control: Fixed percentage stop-loss and take-profit strategy controls risk per trade
- Excellent visualization: Clear display of trading signals through labels and graphics for analysis and optimization
Strategy Risks
- Choppy market risk: May generate frequent false breakout signals in sideways markets
- Slippage risk: Potentially significant slippage in fast-moving markets
- Parameter sensitivity: Strategy performance heavily depends on indicator parameter selection
- Signal lag: May miss some quick moves due to the need for new swing point confirmation
Optimization Directions
- Add market environment filtering: Incorporate volatility indicators to identify market conditions and use different parameters accordingly
- Dynamic stop-loss optimization: Adjust stop-loss positions based on ATR or volatility
- Volume confirmation integration: Add volume verification when generating signals
- Time filtering: Add trading time period filters to avoid highly volatile sessions
Summary
This is a complete trading system combining trend following and momentum trading. Through the synergy of multiple technical indicators, it maintains a high win rate while effectively controlling risk. Although there is some lag, stable trading results can be achieved through proper parameter optimization and risk management. The strategy is particularly suitable for medium to long-term trend markets and performs better when there are clear directional opportunities.
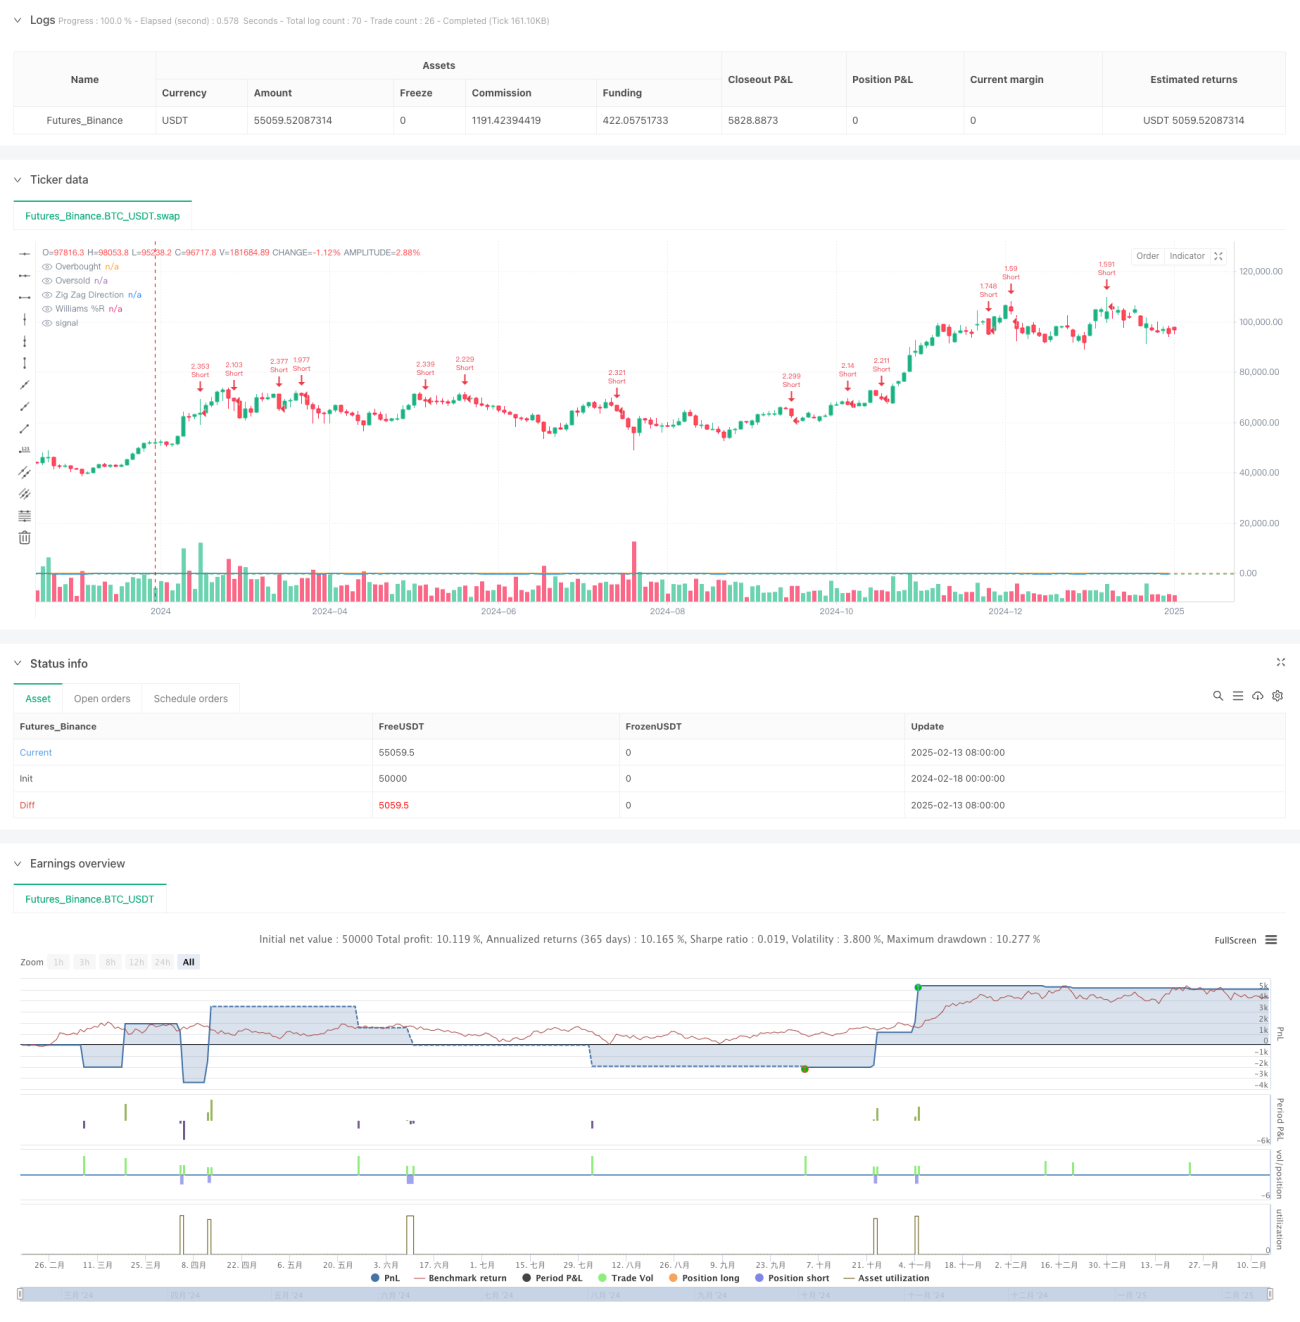
/*backtest
start: 2024-02-18 00:00:00
end: 2025-02-15 08:00:00
period: 2d
basePeriod: 2d
exchanges: [{"eid":"Futures_Binance","currency":"BTC_USDT"}]
*/

//@version=6
strategy("Zig Zag + Williams %R Strategy", overlay=true, default_qty_type=strategy.percent_of_equity, default_qty_value=300)

// ====================- 1