概述
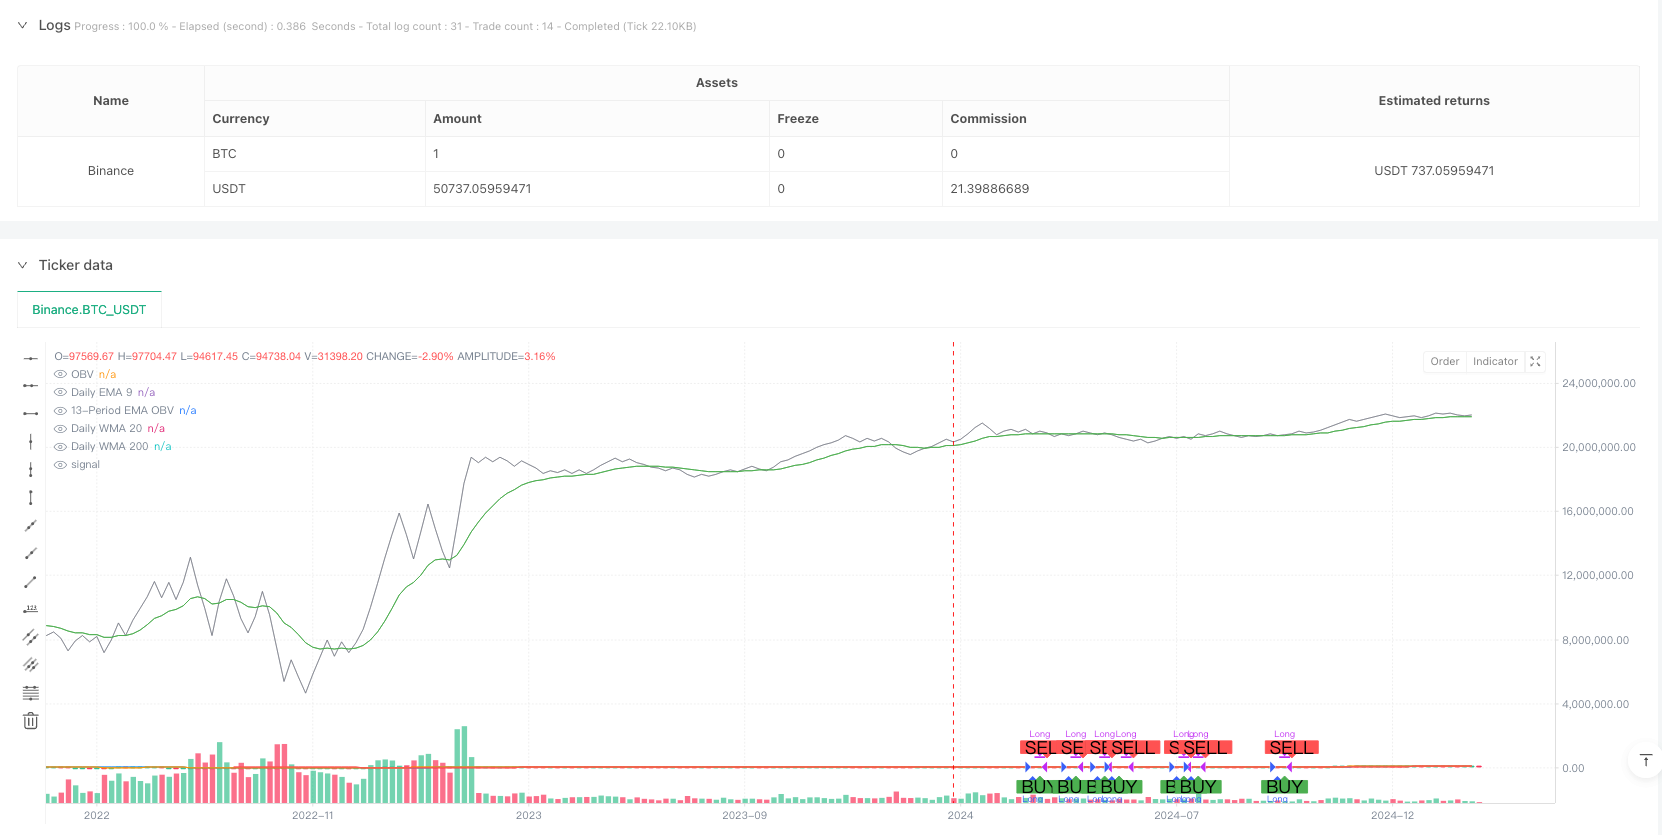
本策略是一个结合了多重移动平均线和交易量平衡指标(OBV)的趋势跟踪系统。该策略利用9日指数移动平均线(EMA)、20日加权移动平均线(WMA)和200日加权移动平均线的协同作用来确定市场趋势,同时结合OBV指标来确认成交量支撑,从而找出更可靠的交易信号。
策略原理
策略运作基于两个核心条件: 1. 趋势确认条件:要求9日EMA、20日WMA和200日WMA都处于上升趋势(当前值大于前一期值)。这种多重时间框架的趋势确认方法可以有效过滤假突破。 2. 成交量确认条件:使用OBV指标及其13周期EMA。当OBV的13期EMA位于OBV之上时,表明成交量支持当前价格走势。
只有当这两个条件同时满足时,策略才会发出做多信号。当条件不再满足时,策略会平仓离场。
策略优势
- 多重确认机制:结合了价格趋势和成交量趋势的双重确认,提高了信号的可靠性。
- 自适应性强:通过使用不同周期的移动平均线,策略能够适应不同的市场环境。
- 风险控制完善:策略采用百分比仓位管理,并设置了合理的佣金考虑。
- 可视化清晰:包含了完整的图形展示系统,便于交易者理解市场状况。
策略风险
- 滞后性风险:移动平均线本质上是滞后指标,可能在剧烈波动市场中反应较慢。
- 震荡市风险:在横盘震荡市场中,可能产生频繁的假信号。
- 资金管理风险:固定百分比仓位管理可能在某些市场条件下不够灵活。
策略优化方向
- 引入动态止损:可以基于ATR或波动率设置动态止损位。
- 优化仓位管理:引入基于波动率的动态仓位管理系统。
- 增加市场环境过滤:添加市场环境识别机制,在不同市场条件下调整策略参数。
- 优化进场时机:可以通过添加RSI等动量指标来优化进场点位。
总结
该策略通过结合多重移动平均线和交易量分析,构建了一个相对完整的趋势跟踪交易系统。策略的核心优势在于其多重确认机制,但同时也需要注意移动平均线固有的滞后性问题。通过建议的优化方向,策略还有进一步提升的空间。
策略源码
/*backtest
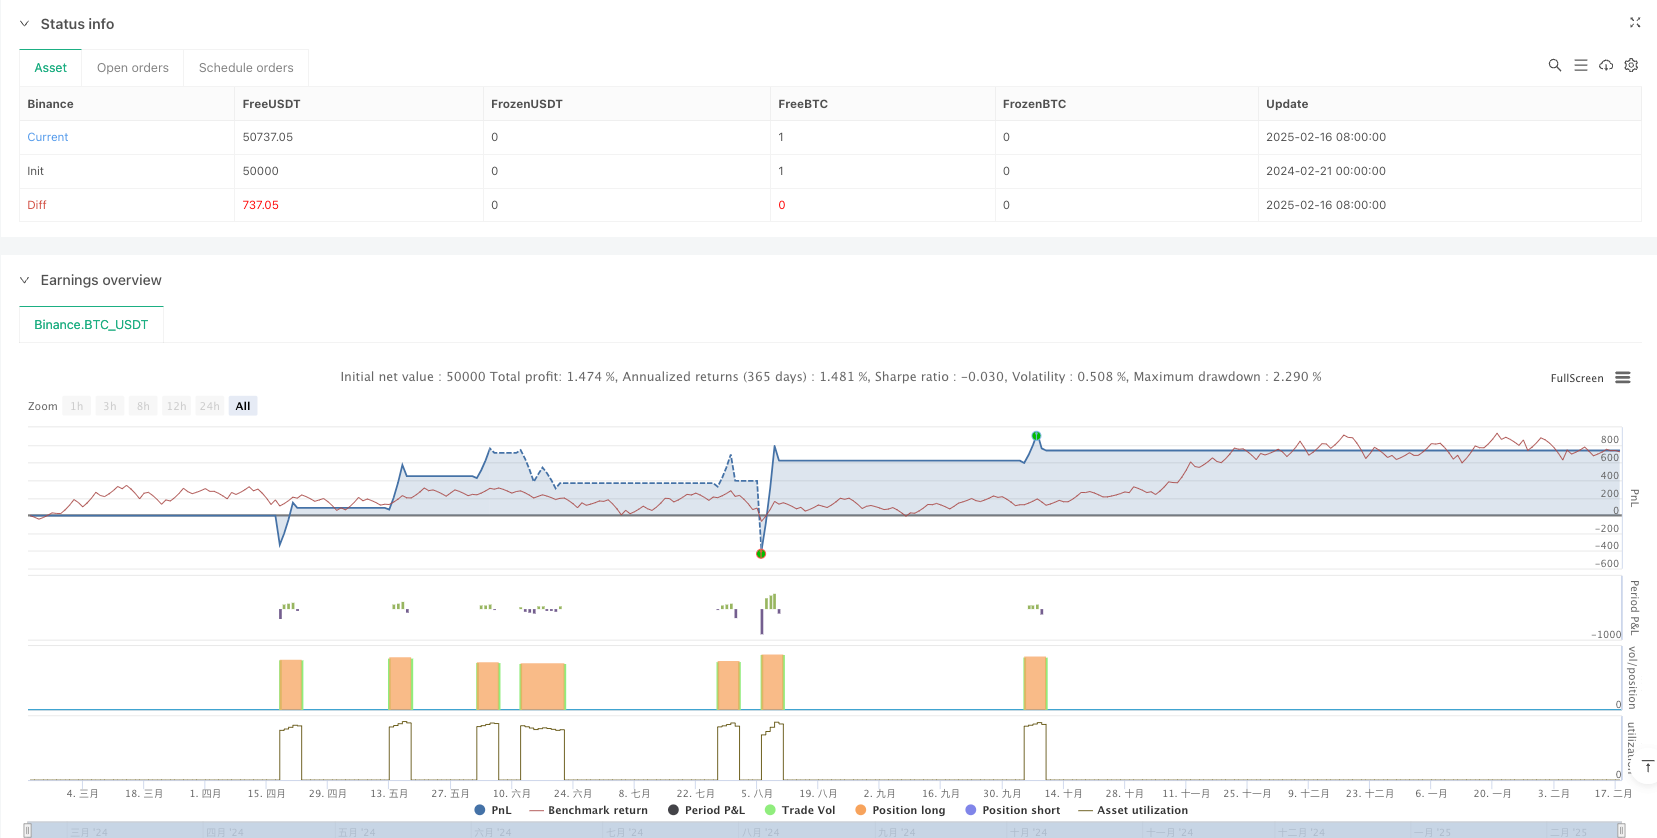
start: 2024-02-21 00:00:00
end: 2025-02-18 08:00:00
period: 5d
basePeriod: 5d
exchanges: [{"eid":"Binance","currency":"BTC_USDT"}]
*/
//@version=6
strategy("Strategy: Daily MAs + OBV", overlay=true, initial_capital=10000, default_qty_type=strategy.percent_of_equity, default_qty_value=10, commission_type=strategy.commission.percent, commission_value=0.1)
//=== Daily Moving Averages Calculation =========================
// Get daily timeframe values using request.security.
dailyEMA9 = request.security(syminfo.tickerid, "D", ta.ema(close, 9))
dailyWMA20 = request.security(syminfo.tickerid, "D", ta.wma(close, 20))
dailyWMA200 = request.security(syminfo.tickerid, "D", ta.wma(close, 200))
// Check if each moving average is trending upward (current > previous).
ema9_up = dailyEMA9 > nz(dailyEMA9[1])
wma20_up = dailyWMA20 > nz(dailyWMA20[1])
wma200_up = dailyWMA200 > nz(dailyWMA200[1])
trend_condition = ema9_up and wma20_up and wma200_up
//=== OBV and its 13-period EMA Calculation ================================
// Calculate OBV manually using a cumulative sum.
obv_val = ta.cum(close > close[1] ? volume : (close < close[1] ? -volume : 0))
// 13-period EMA of the OBV.
ema13_obv = ta.ema(obv_val, 13)
// Condition: 13-period EMA of OBV must be above the OBV value.
obv_condition = ema13_obv > obv_val
//=== Entry Condition ===================================================
// Both trend and OBV conditions must be met.
buy_condition = trend_condition and obv_condition
//=== Entry and Exit Orders =============================================
// Enter a long position when the buy condition is met and no position is open.
if buy_condition and strategy.position_size <= 0
strategy.entry("Long", strategy.long)
// Exit the position when the condition is no longer met.
if not buy_condition and strategy.position_size > 0
strategy.close("Long")
//=== Explicit Entry and Exit Markers ====================================
// Determine the exact bar where entry and exit occur.
entry_signal = (strategy.position_size > 0 and (strategy.position_size[1] <= 0))
exit_signal = (strategy.position_size == 0 and (strategy.position_size[1] > 0))
plotshape(entry_signal, title="Entry Signal", location=location.belowbar, style=shape.labelup, text="BUY", color=color.new(color.green, 0), size=size.normal)
plotshape(exit_signal, title="Exit Signal", location=location.abovebar, style=shape.labeldown, text="SELL", color=color.new(color.red, 0), size=size.normal)
//=== Plots for Visualization ===============================================
// Plot daily moving averages.
plot(dailyEMA9, color=color.blue, title="Daily EMA 9")
plot(dailyWMA20, color=color.orange, title="Daily WMA 20")
plot(dailyWMA200, color=color.red, title="Daily WMA 200")
// Plot OBV and its 13-period EMA using color.new() to specify transparency.
plot(obv_val, color=color.new(color.gray, 30), title="OBV")
plot(ema13_obv, color=color.new(color.green, 0), title="13-Period EMA OBV")
相关推荐