概述
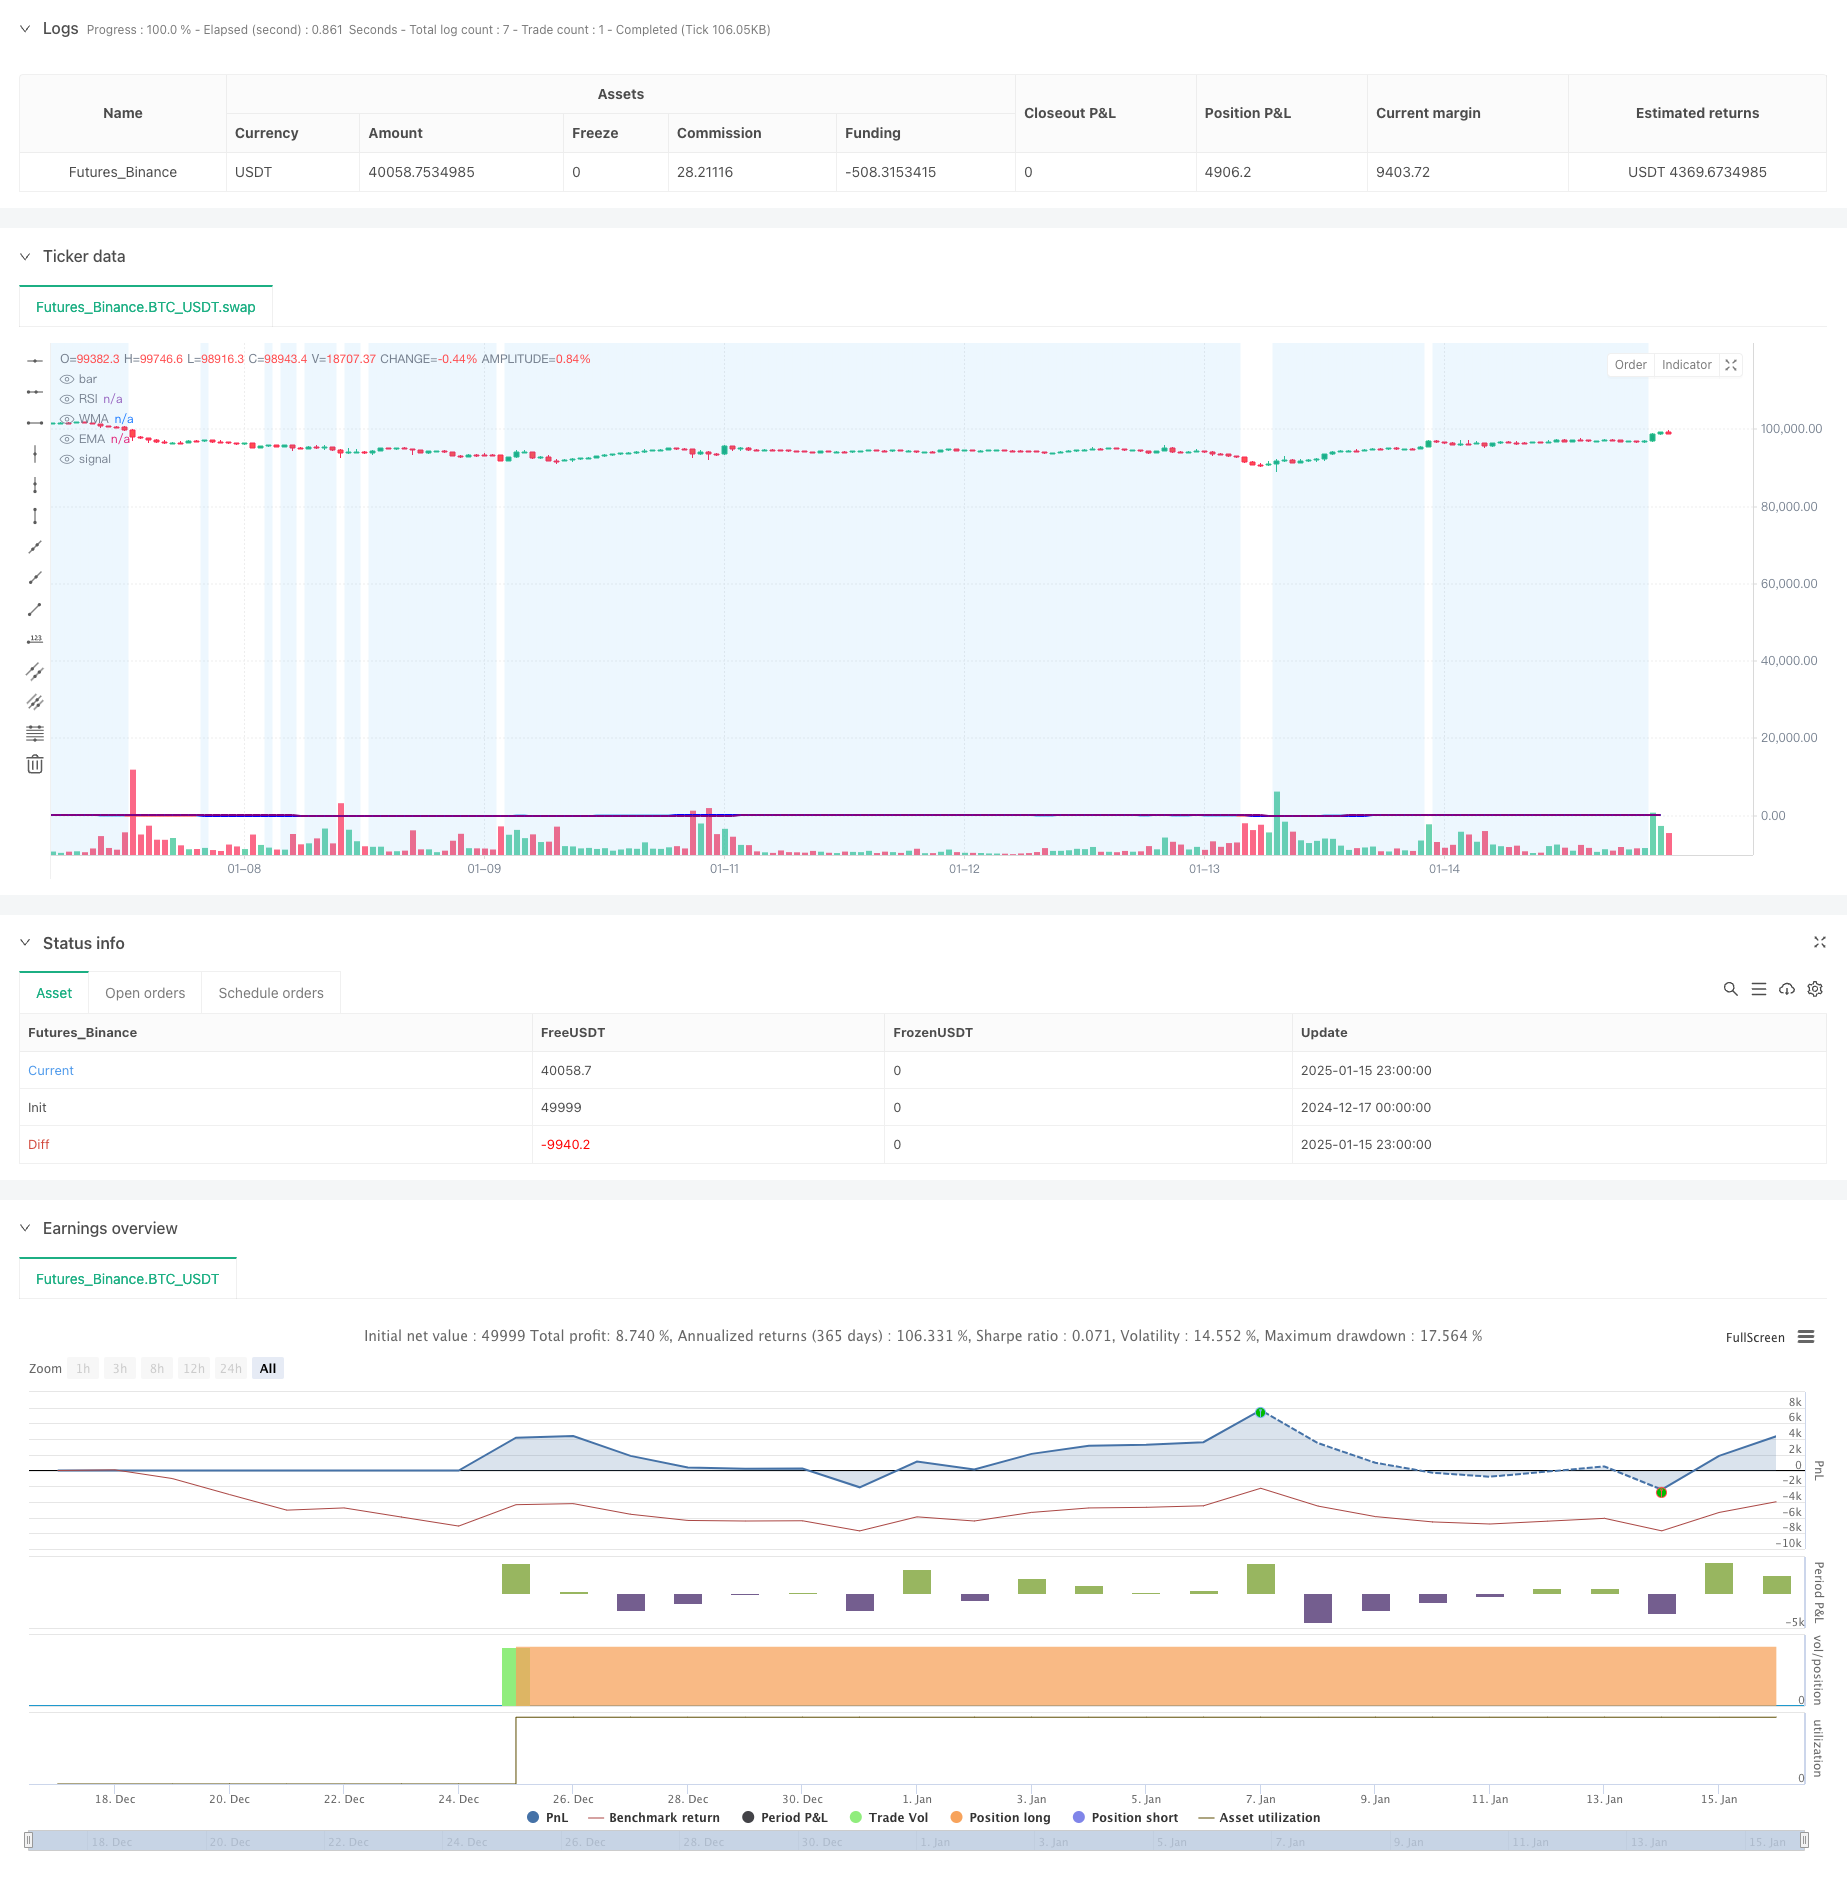
该策略是一个结合了相对强弱指数(RSI)、加权移动平均线(WMA)和指数移动平均线(EMA)的趋势跟踪交易系统。策略通过多重技术指标的配合使用,在趋势转折点捕捉市场动量变化,从而实现交易信号的产生。系统采用WMA和EMA的交叉来确认趋势方向,同时结合RSI指标来过滤市场状态,以提高交易的准确性。
策略原理
策略的核心逻辑基于以下几个关键要素: 1. RSI指标计算采用14周期,用于衡量市场的超买超卖状态 2. 45周期WMA和89周期EMA的交叉用于确认趋势的转换 3. 入场条件: - 做多信号:WMA上穿EMA且RSI<50 - 做空信号:WMA下穿EMA且RSI>50 4. 系统通过RSI的颜色变化来可视化市场状态,当RSI>70时显示绿色,<30时显示红色 5. 在RSI 30-70区间内设置蓝色背景,帮助识别中性区域
策略优势
- 多重技术指标的结合提高了交易信号的可靠性
- WMA对近期价格变化反应更敏感,而EMA则保持了对长期趋势的跟踪
- RSI作为过滤器可以有效避免在过度波动的市场中产生错误信号
- 视觉化的界面设计有助于交易者直观判断市场状态
- 包含完整的警报系统,可及时通知交易者潜在的交易机会
策略风险
- 在横盘市场中可能产生频繁的假突破信号
- 移动平均线的滞后性可能导致入场时机略有延迟
- RSI阈值的固定设置可能不适用于所有市场环境
- 没有考虑波动率因素,在高波动期可能增加风险
- 缺乏止损和止盈机制,可能影响资金管理效果
策略优化方向
- 引入自适应的RSI阈值,根据市场波动状态动态调整
- 增加ATR指标来控制持仓规模和设置动态止损
- 优化WMA和EMA的周期设置,可考虑根据不同时间框架调整
- 添加成交量指标作为辅助确认信号
- 实现更复杂的仓位管理系统,如金字塔式加仓和减仓
总结
这是一个基于多重技术指标的趋势跟踪策略,通过RSI、WMA和EMA的配合使用,在保证交易稳定性的同时,努力捕捉市场趋势转换点。虽然存在一定的滞后性和假信号风险,但通过合理的优化和风险管理措施,该策略具有良好的实用价值和扩展空间。
策略源码
/*backtest
start: 2024-12-17 00:00:00
end: 2025-01-16 00:00:00
period: 1h
basePeriod: 1h
exchanges: [{"eid":"Futures_Binance","currency":"BTC_USDT","balance":49999}]
*/

//@version=5
strategy(title="RSI + WMA + EMA Strategy", shorttitle="RSI Strategy", overlay=true)

// RSI Settings
rsiLengthInput = input.int(14, minval=1, title="RSI Length", group="RSI Settings")
rsiSourceInput = input.source(close, "Source", group="RSI Settings")

// WMA and EMA Settings
wmaLengthInput = input.int(45, minval=1, title="WMA Length", group="WMA Settings")
wmaColorInput = input.color(color.blue, title="WMA Color", group="WMA Settings")
emaLengthInput = input.int(89, minval=1, title="EMA Length", group="EMA Settings")
emaColorInput = input.color(color.purple, title="EMA Color", group="EMA Settings")

// RSI Calculation
change = ta.change(rsiSourceInput)
up = ta.rma(math.max(change, 0), rsiLengthInput)
down = ta.rma(-math.min(change, 0), rsiLengthInput)
rsi = down == 0 ? 100 : up == 0 ? 0 : 100 - (100 / (1 + up / down))

// WMA and EMA Calculation
wma = ta.wma(rsi, wmaLengthInput)
ema = ta.ema(rsi, emaLengthInput)

// RSI Color Logic
rsiColor = rsi > 70 ? color.new(color.green, 100 - math.round(rsi)) : rsi < 30 ? color.new(color.red, math.round(rsi)) : color.new(color.blue, 50)

// Plot RSI, WMA, and EMA
plot(rsi, "RSI", color=rsiColor)
plot(wma, title="WMA", color=wmaColorInput, linewidth=2)
plot(ema, title="EMA", color=emaColorInput, linewidth=2)

// Highlight RSI Area between 30 and 70
bgcolor(rsi >= 30 and rsi <= 70 ? color.new(color.blue, 90) : na)

// Entry and Exit Conditions
longCondition = ta.crossover(wma, ema) and rsi < 50
shortCondition = ta.crossunder(wma, ema) and rsi > 50

if (longCondition)
    strategy.entry("Long", strategy.long)
    alert("Buy Signal: WMA crossed above EMA, RSI < 50", alert.freq_once_per_bar)

if (shortCondition)
    strategy.entry("Short", strategy.short)
    alert("Sell Signal: WMA crossed below EMA, RSI > 50", alert.freq_once_per_bar)

// Optional: Plot Buy/Sell Signals on Chart
plotshape(series=longCondition, style=shape.labelup, location=location.belowbar, color=color.green, size=size.small, title="Buy Signal")
plotshape(series=shortCondition, style=shape.labeldown, location=location.abovebar, color=color.red, size=size.small, title="Sell Signal")
相关推荐