多重过滤RSI动量确认交易策略

RSI ATR supertrend SMA EMA RMA WMA
创建日期: 2025-05-22 10:28:45 最后修改: 2025-05-22 10:28:45
复制: 1 点击次数: 114
avatar of ianzeng123 ianzeng123
2
关注
56
关注者

多重过滤RSI动量确认交易策略 多重过滤RSI动量确认交易策略

概述

多重过滤RSI动量确认交易策略是一种专为加密货币市场设计的系统性交易方法。该策略通过结合RSI动量信号、成交量确认和精确的K线形态识别来识别高概率入场点,同时过滤掉弱信号。策略实施多层过滤系统,要求多个条件同时满足才能进入交易,通过要求RSI动量转换、显著成交量和强劲K线形态,系统旨在仅捕获最可靠的交易设置。

该策略的核心在于其多重确认机制的强大组合。RSI识别潜在的动量转换但在震荡市场中可能产生虚假信号,成交量确认确保只有在存在足够市场兴趣时才进行交易,K线形态要求通过要求强劲的价格行动来过滤掉弱反转。当这三个过滤器结合使用时,显著减少了虚假信号,同时捕获强劲的动量转换。策略还包含内置的风险管理功能,基于ATR波动率或固定百分比风险提供自动止损和获利了结位置设定。

策略原理

该策略的核心逻辑建立在三个主要技术指标的协同作用之上。首先是RSI动量检测机制,策略使用14周期RSI指标,设定70作为超买水平,30作为超卖水平。对于多头入场,系统检测RSI从30以下向上穿越30的情况,这表明从超卖状态向看涨动量的转变。对于空头入场,系统识别RSI从70以上向下穿越70的情况,表明从超买状态向看跌动量的转变。

第二个关键组件是成交量确认系统。策略要求当前K线的成交量必须超过14周期成交量简单移动平均线,这确保交易只在具有足够市场参与度的情况下执行,从而过滤掉低流动性环境中的虚假突破。第三个过滤器是K线形态分析,要求强劲的看涨或看跌K线,其中实体部分必须占据K线总范围的至少50%,这确保价格行动具有决定性特征,避免了在不确定市场条件下的弱信号。

策略还提供可选的超级趋势过滤器,当启用时,多头入场必须与超级趋势的上升方向对齐,空头入场必须与下降趋势对齐。动态ATR止损系统根据当前市场波动率调整保护水平,使用3.5倍ATR乘数来计算止损和获利目标,或者提供固定0.5%止损的选项,风险回报比设定为1.5:1。

优势分析

多重过滤RSI动量确认交易策略具有多项显著优势。首先是其强大的信号过滤能力,通过要求RSI动量转换、成交量确认和强劲K线形态三个条件同时满足,策略大幅降低了虚假信号的概率。这种多重确认机制确保只有在市场显示出真正动量转换迹象时才执行交易,从而提高了交易的成功率。

其次,策略具有出色的适应性和灵活性。动态ATR止损系统能够根据市场波动率自动调整保护水平,在高波动期提供更宽松的止损,在低波动期收紧保护,这种自适应特性使策略能够在不同市场条件下保持有效性。可选的超级趋势过滤器为交易者提供了额外的趋势确认工具,进一步提高信号质量。

第三个重要优势是全面的风险管理体系。策略提供两种退出方式,ATR基础的动态止损和固定百分比止损,交易者可以根据自己的风险偏好选择合适的方法。1.5:1的风险回报比设置确保了良好的盈亏平衡点,即使胜率稍低也能保持盈利能力。策略还支持多种交易方向配置,包括仅多头、仅空头或双向交易。

风险分析

尽管该策略具有多重过滤机制,但仍存在一些潜在风险需要注意。首要风险是在强趋势市场中可能错过交易机会。由于策略依赖RSI的超买超卖信号,在持续上涨或下跌的强趋势中,RSI可能长时间保持在极端水平,导致策略无法生成入场信号,从而错过重要的趋势机会。解决方法是结合更高时间框架的趋势分析,或者调整RSI参数以适应特定市场条件。

第二个重要风险是在震荡市场中的频繁交易。虽然多重过滤器减少了虚假信号,但在横盘整理阶段,市场可能仍会产生多个看似有效但最终失败的突破信号。这可能导致连续小额亏损的累积。缓解策略包括增加额外的市场状态过滤器,如波动率指标或趋势强度指标,在低趋势环境中暂停交易。

第三个风险涉及参数优化过度拟合。策略包含多个可调参数,包括RSI长度、ATR周期、风险回报比等,过度优化这些参数以适应历史数据可能导致未来表现不佳。建议使用稳健的参数设置,定期进行样本外测试,并避免基于有限历史数据的过度优化。此外,交易成本和滑点在高频交易环境中可能显著影响策略表现,特别是在较小时间框架上操作时。

优化方向

该策略具有多个重要的优化方向。首先是增强市场状态识别能力,可以集成额外的市场分类指标,如平均真实范围比率、波动率指数或趋势强度指标,以更好地识别不同的市场环境。在高波动率环境中,策略可以调整RSI阈值或增加额外的确认条件;在低波动率环境中,可以收紧参数以提高信号敏感度。这种自适应参数调整将显著提高策略在不同市场条件下的表现。

第二个优化方向是实施多时间框架分析。当前策略主要在单一时间框架上操作,通过整合更高时间框架的趋势确认,可以显著提高信号质量。例如,在5分钟图上执行策略时,可以要求15分钟或1小时图上的趋势方向对齐。这种方法将减少逆趋势交易的频率,提高整体胜率。

第三个关键优化是动态位置管理系统的实施。当前策略使用固定的风险回报比,但可以根据市场波动率、信号强度或历史表现动态调整位置大小和目标。在高确定性信号时增加仓位,在不确定性较高时减少仓位,这种动态调整将最大化资本效率。

第四个优化方向是集成机器学习组件。可以使用历史数据训练模型来识别最优的入场条件组合,或者预测信号成功的概率。这种方法可以根据当前市场条件动态调整策略参数,而不是依赖静态设置。

总结

多重过滤RSI动量确认交易策略代表了一种成熟的量化交易方法,通过巧妙结合技术指标、成交量分析和风险管理创造了一个强大的交易系统。该策略的核心优势在于其多层过滤机制,有效减少了虚假信号同时保持了对真实市场机会的敏感性。动态ATR止损系统和灵活的参数配置使其能够适应不同的市场环境和交易偏好。

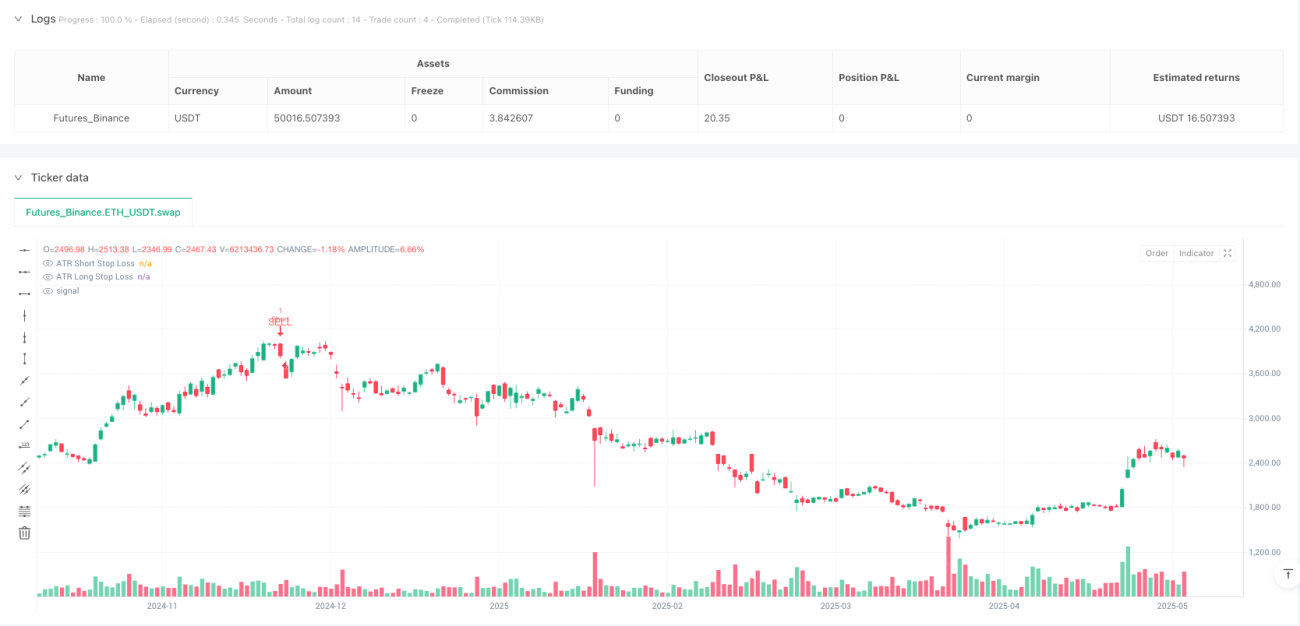
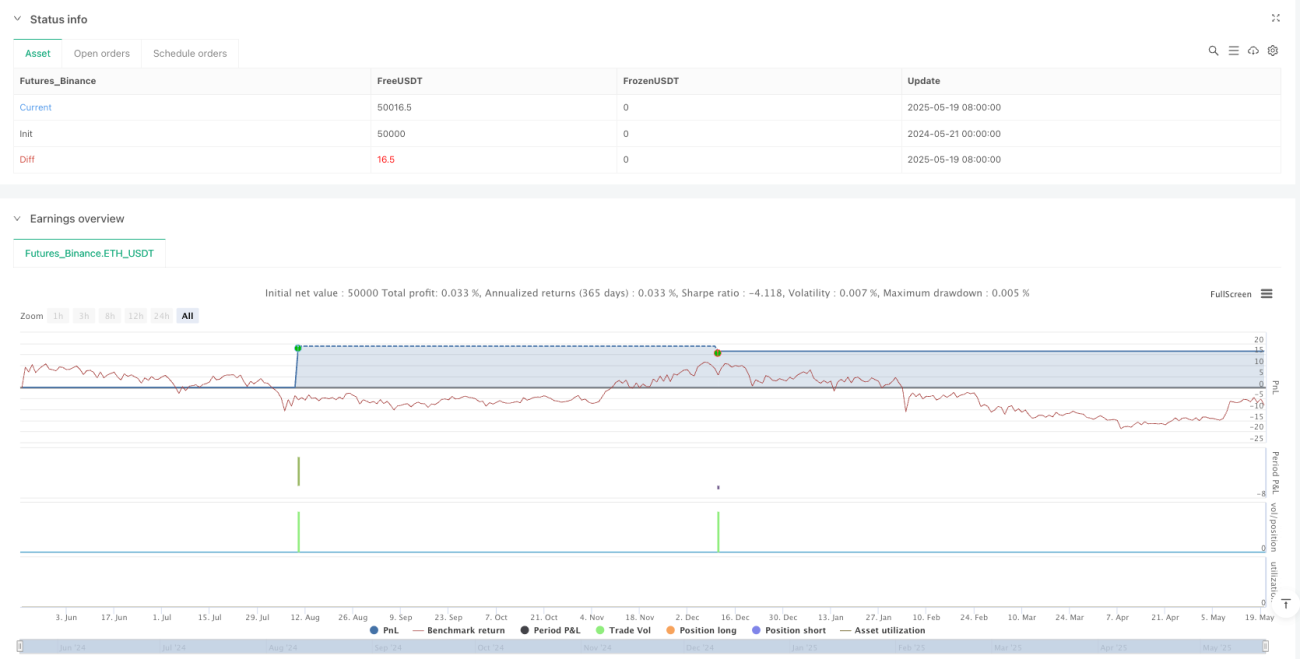
策略在BTCUSDT 5分钟图表上的回测结果显示了良好的表现,58.49%的胜率、1.472的盈利因子和仅3.01%的最大回撤证明了其风险调整后收益的有效性。然而,交易者必须认识到任何策略都存在固有风险,特别是在快速变化的加密货币市场中。

成功实施该策略需要持续的监控、定期的参数评估以及对市场条件变化的适应性调整。通过建议的优化方向,特别是多时间框架分析和动态参数调整,该策略具有进一步提升表现的巨大潜力。最终,这种策略为寻求系统性方法进入加密货币交易的交易者提供了一个坚实的基础,但应始终与适当的风险管理和持续学习相结合。

策略源码
/*backtest
start: 2024-05-21 00:00:00
end: 2025-05-20 08:00:00
period: 1d
basePeriod: 1d
exchanges: [{"eid":"Futures_Binance","currency":"ETH_USDT"}]
*/

// This Pine Script™ code is subject to the terms of the Mozilla Public License 2.0 at https://mozilla.org/MPL/2.0/
// © nioboi

// Best settings already at default. 
// Use at BTCUSDT 5m chart
// strategy properties: start with 100 usdt capital, set order size to be 20 usdt
// for indicator use (buy sell signals only), rightclick on chart and disable "Trades On Chart"

//@version=6
strategy("Volume FIltered RSI Buy/Sell Strategy", overlay=true, process_orders_on_close=true, commission_value=0.055, initial_capital=100, currency=currency.USDT, pyramiding=1)

// =========================================
// Input Groups
// =========================================
string rsi_group = "RSI"
string atr_sl_finder_group = "ATR SL Finder"
string trade_execution_group = "Strategy Execution"
string supertrend_group = "Supertrend Filter"
string range_filter_group = "Range Detector Filter"

// =========================================
// RSI Calculation
// =========================================
rsi_ob = input.int(70, "Overbought Level", group=rsi_group)
rsi_os = input.int(30, "Oversold Level", group=rsi_group)
rsiLengthInput = input.int(14, minval=1, title="RSI Length", group=rsi_group)
rsiSourceInput = input.source(close, "Source", group=rsi_group)

change = ta.change(rsiSourceInput)
up = ta.rma(math.max(change, 0), rsiLengthInput)
down = ta.rma(-math.min(change, 0), rsiLengthInput)
rsi = down == 0 ? 100 : up == 0 ? 0 : 100 - (100 / (1 + up / down))

rsi_can_long = rsi[1] < rsi_os and rsi >= rsi_os
rsi_can_short = rsi[1] > rsi_ob and rsi <= rsi_ob

// =========================================
// Candle Body Conditions
// =========================================
isBullCandle = close > open and (math.abs(close - open) > (high - low) * 0.5)
isBearCandle = close < open and (math.abs(close - open) > (high - low) * 0.5)

// =========================================
// Volume Filter
// =========================================
has_volume = volume >= ta.sma(volume, 14)

// Initial can_long and can_short
can_long = rsi_can_long and isBullCandle and has_volume
can_short = rsi_can_short and isBearCandle and has_volume

// =========================================
// Supertrend Filter
// =========================================
useSupertrendFilter = input.bool(false, "Use Supertrend Filter", group=supertrend_group)
st_tf = input.timeframe("", "Supertrend Timeframe", group=supertrend_group)
atrPeriod = input.int(10, "ATR Length", minval=1, group=supertrend_group)
factor = input.float(3.0, "Factor", minval=0.01, step=0.01, group=supertrend_group)

[supertrendVal, directionVal] = request.security(syminfo.tickerid, st_tf, ta.supertrend(factor, atrPeriod))

if useSupertrendFilter
    can_long := can_long and directionVal < 0 and close > supertrendVal
    can_short := can_short and directionVal > 0 and close < supertrendVal

// =========================================
// ATR SL Finder © Veryfid
// =========================================
atrlength = input.int(title='Length', defval=14, minval=1, group=atr_sl_finder_group)
smoothing = input.string(title='Smoothing', defval='RMA', options=['RMA','SMA','EMA','WMA'], group=atr_sl_finder_group)
m = input(3.5, 'Multiplier', group=atr_sl_finder_group)
src1 = high
src2 = low

ma_function(source, length) =>
    if smoothing == 'RMA'
        ta.rma(source, length)
    else
        if smoothing == 'SMA'
            ta.sma(source, length)
        else
            if smoothing == 'EMA'
                ta.ema(source, length)
            else
                ta.wma(source, length)

x = ma_function(ta.tr(true), atrlength) * m + src1 // SHORT SL
x2 = src2 - ma_function(ta.tr(true), atrlength) * m // LONG SL

p1 = plot(x, title="ATR Short Stop Loss", color=#ffffff18)
p2 = plot(x2, title="ATR Long Stop Loss", color=#ffffff18)

// =========================================
// Strategy Execution
// =========================================
tradeDirection = input.string("Both", "Trade Direction", ["Long Only","Short Only","Both"], group=trade_execution_group)
risk_reward_ratio = input.float(1.5, "Risk Reward Ratio", group=trade_execution_group)
exit_strategy = input.string("Fixed Percent", "Exit Strategy", ["ATR","Fixed Percent"], group=trade_execution_group)
SLPercent = input.float(0.5, "Stoploss Percent (%)", group=trade_execution_group)

enterLong = can_long and (tradeDirection == "Long Only" or tradeDirection == "Both")
enterShort = can_short and (tradeDirection == "Short Only" or tradeDirection == "Both")

var bool plotMarkers_long = false
var float sl_long = na
var float tp2_long = na
var float entryPrice_long = na

var bool plotMarkers_short = false
var float sl_short = na
var float tp2_short = na
var float entryPrice_short = na

if exit_strategy == "ATR"
    // Long Entries
    if enterLong and strategy.position_size == 0
        entryPrice_long := close
        sl_long := x2
        risk = entryPrice_long - sl_long
        tp2_long := entryPrice_long + (risk_reward_ratio * risk)
        strategy.entry("Long", strategy.long)
        strategy.exit("Exit Long", "Long", limit=tp2_long, stop=sl_long)
    // Short Entries
    if enterShort and strategy.position_size == 0
        entryPrice_short := close
        sl_short := x
        risk = sl_short - entryPrice_short
        tp2_short := entryPrice_short - (risk_reward_ratio * risk)
        strategy.entry("Short", strategy.short)
        strategy.exit("Exit Short", "Short", limit=tp2_short, stop=sl_short)

if exit_strategy == "Fixed Percent"
    // Long Entries
    if enterLong and strategy.position_size == 0
        entryPrice_long := close
        sl_long := close * (1 - SLPercent / 100)
        risk = entryPrice_long - sl_long
        tp2_long := entryPrice_long + (risk_reward_ratio * risk)
        strategy.entry("Long", strategy.long)
        strategy.exit("Exit Long", "Long", limit=tp2_long, stop=sl_long)
    // Short Entries
    if enterShort and strategy.position_size == 0
        entryPrice_short := close
        sl_short := close * (1 + SLPercent / 100)
        risk = sl_short - entryPrice_short
        tp2_short := entryPrice_short - (risk_reward_ratio * risk)
        strategy.entry("Short", strategy.short)
        strategy.exit("Exit Short", "Short", limit=tp2_short, stop=sl_short)

// Entry Visual Flags
if strategy.position_size == 0
    plotMarkers_long := false
    plotMarkers_short := false
if strategy.position_size > 0
    plotMarkers_long := true
    plotMarkers_short := false
else if strategy.position_size < 0
    plotMarkers_long := false
    plotMarkers_short := true

// SL and TP Lines
longEntryMarker = plot(plotMarkers_long ? entryPrice_long : na, "Entry Marker L", color=na)
longSLMarker = plot(plotMarkers_long ? sl_long : na, "SL Marker L", color=#ff000050, linewidth=1, style=plot.style_linebr)
longTP2Marker = plot(plotMarkers_long ? tp2_long : na, "TP2 Marker L", color=#1100ff50, linewidth=1, style=plot.style_linebr)

plotshape(enterLong and strategy.position_size == 0, "BUY", shape.triangleup, location.belowbar, color.green, text="BUY", size=size.small, textcolor=color.green)
plotshape(enterShort and strategy.position_size == 0, "SELL", shape.triangledown, location.abovebar, color.red, text="SELL", size=size.small, textcolor=color.red)

shortEntryMarker = plot(plotMarkers_short ? entryPrice_short : na, "Entry Marker S", color=na)
shortSLMarker = plot(plotMarkers_short ? sl_short : na, "SL Marker S", color=#ff000050, linewidth=1, style=plot.style_linebr)
shortTP2Marker = plot(plotMarkers_short ? tp2_short : na, "TP2 Marker S", color=#1100ff50, linewidth=1, style=plot.style_linebr)

// SL and TP Fills
fill(plot1=longEntryMarker, plot2=longSLMarker, title="Long SL BG Fill", color=#b2283320)
fill(plot1=longEntryMarker, plot2=longTP2Marker, title="Long TP BG Fill", color=#08998120)
fill(plot1=shortEntryMarker, plot2=shortSLMarker, title="Short SL BG Fill", color=#b2283320)
fill(plot1=shortEntryMarker, plot2=shortTP2Marker, title="Short TP BG Fill", color=#08998120)

// Supertrend Plots (Only show if using supertrend filter)
upTrend = plot(useSupertrendFilter ? (directionVal < 0 ? supertrendVal : na) : na, "Up Trend", color=color.new(color.green,0), style=plot.style_linebr)
downTrend = plot(useSupertrendFilter ? (directionVal < 0 ? na : supertrendVal) : na, "Down Trend", color=color.new(color.red,0), style=plot.style_linebr)
bodyMiddle = plot(useSupertrendFilter ? (barstate.isfirst ? na : (open + close) / 2) : na, "Body Middle", display=display.none)

fill(bodyMiddle, upTrend,   color.new(color.green, 90), fillgaps=false)
fill(bodyMiddle, downTrend, color.new(color.red,   90), fillgaps=false)
相关推荐