
概述
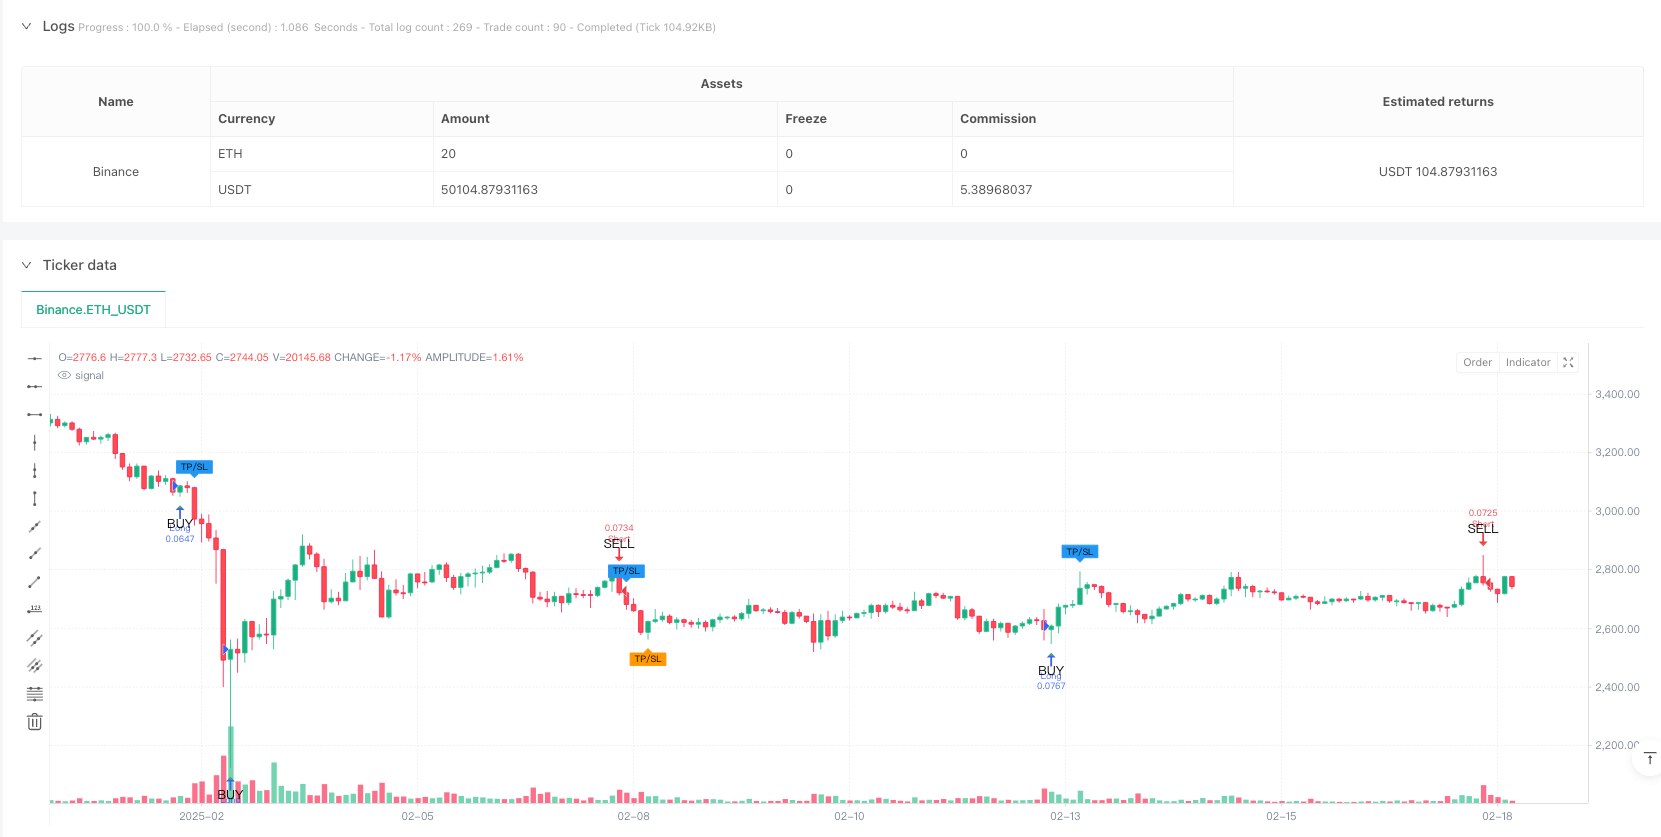
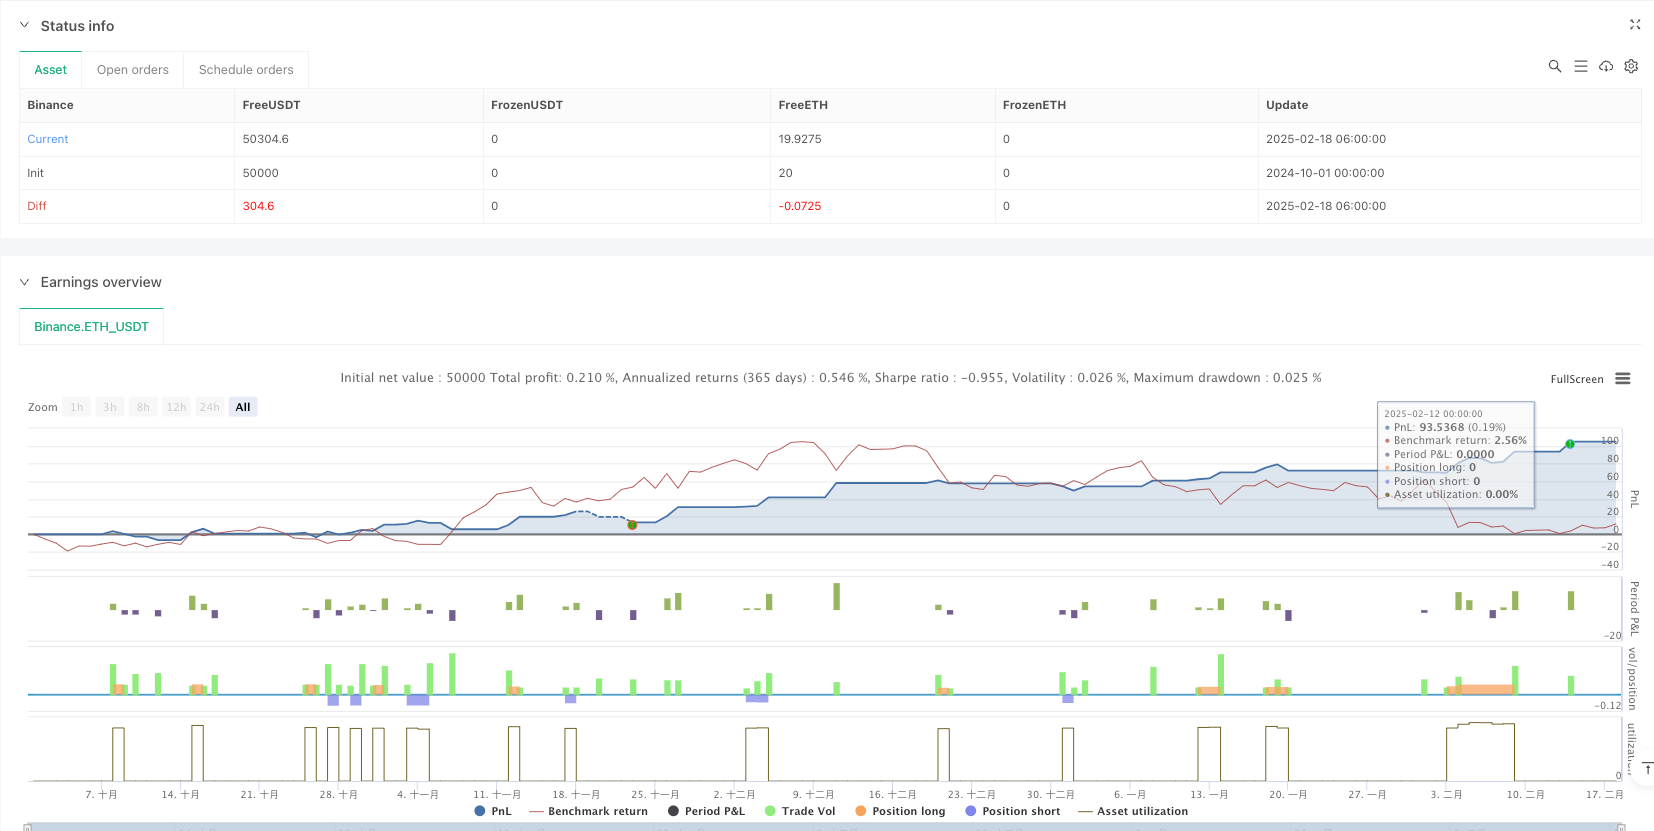
该策略是一个结合了多个技术指标的完整交易系统,主要基于Z分数来衡量交易量和K线实体大小的异常值,并使用ATR(平均真实波幅)来设置动态止损位。系统还整合了风险收益比(RR)来优化获利目标,通过多维度的技术分析提供可靠的交易信号。
策略原理
策略的核心逻辑基于以下几个关键组件: 1. Z分数分析:计算交易量和K线实体的标准差,识别市场异常活跃度 2. 趋势确认:通过分析相邻K线的高低点和收盘价来确认趋势方向 3. ATR止损:使用动态ATR值设置止损位置,提供更灵活的风险控制 4. 风险收益比:基于设定的RR比例自动计算获利目标 5. 可视化标记:在图表上标注交易信号和关键价格水平
策略优势
- 多维度信号确认:结合成交量、价格动量和趋势方向,提高交易信号的可靠性
- 动态风险管理:通过ATR实现自适应止损,better适应市场波动
- 灵活的参数配置:允许调整Z分数阈值、ATR倍数和风险收益比
- 精确的入场时机:使用Z分数异常值识别关键交易机会
- 清晰的可视化:在图表上明确标注入场点、止损位和获利目标
策略风险
- 参数敏感性:Z分数阈值和ATR倍数的设置直接影响交易频率和风险控制
- 市场环境依赖:在低波动率环境下可能产生较少的交易信号
- 计算复杂性:多重指标计算可能导致信号生成延迟
- 滑点风险:在快速市场中可能面临实际执行价格与信号价格的偏差
- 假突破风险:在盘整市场中可能触发错误的突破信号
策略优化方向
- 市场环境过滤:添加市场波动率过滤器,在不同市场环境下动态调整参数
- 信号确认机制:引入更多技术指标进行交叉验证,如RSI或MACD
- 仓位管理优化:基于波动率和账户风险实现动态仓位调整
- 多时间周期分析:整合更高时间周期的趋势确认,提高交易成功率
- 信号过滤优化:增加额外的过滤条件以减少假信号
总结
该策略通过结合Z分数分析、ATR止损和风险收益比优化,构建了一个完整的交易系统。系统的优势在于多维度的信号确认和灵活的风险管理,但仍需注意参数设置和市场环境的影响。通过建议的优化方向,策略可以进一步提升其稳定性和适应性。
策略源码
/*backtest
start: 2024-10-01 00:00:00
end: 2025-02-18 08:00:00
period: 2h
basePeriod: 2h
exchanges: [{"eid":"Binance","currency":"ETH_USDT"}]
*/

//@version=5
strategy("admbrk | Candle Color & Price Alarm with ATR Stop", overlay=true, initial_capital=50, default_qty_type=strategy.cash, default_qty_value=200, commission_type=strategy.commission.percent, commission_value=0.05, pyramiding=3)

// **Risk/Reward ratio (RR) as input**
rr = input.float(2.0, title="Risk/Reward Ratio (RR)", step=0.1)

// **Z-score calculation function**
f_zscore(src, len) =>
    mean = ta.sma(src, len)
    std = ta.stdev(src, len)
    (src - mean) / std

// **Z-score calculations**
len = input(20, "Z-Score MA Length")
z1 = input.float(1.5, "Threshold z1", step=0.1)
z2 = input.float(2.5, "Threshold z2", step=0.1)

z_volume = f_zscore(volume, len)
z_body = f_zscore(math.abs(close - open), len)

i_src = input.string("Volume", title="Source", options=["Volume", "Body size", "Any", "All"])

float z = na
if i_src == "Volume"
    z := z_volume
else if i_src == "Body size"
    z := z_body
else if i_src == "Any"
    z := math.max(z_volume, z_body)
else if i_src == "All"
    z := math.min(z_volume, z_body)

// **Determine trend direction**
green = close >= open
red = close < open

// **Long and Short signals**
longSignal = barstate.isconfirmed and red[1] and low < low[1] and green
shortSignal = barstate.isconfirmed and green[1] and high > high[1] and red

long = longSignal and (z >= z1)
short = shortSignal and (z >= z1)

// **ATR calculation (for ATR Stop)**
atrLength = input.int(14, title="ATR Length")
atrMultiplier = input.float(1.5, title="ATR Stop Multiplier")
atrValue = ta.atr(atrLength)

// **ATR-based stop-loss calculation**
long_atr_stop = close - atrValue * atrMultiplier
short_atr_stop = close + atrValue * atrMultiplier

// **Stop-loss setting (set to the lowest/highest wick of the last two bars)**
long_sl = ta.lowest(low, 2)  // Long stop-loss (lowest of the last 2 bars)
short_sl = ta.highest(high, 2) // Short stop-loss (highest of the last 2 bars)

// **Take-profit calculation (with RR)**
long_tp = close + (close - long_sl) * rr
short_tp = close - (short_sl - close) * rr

triggerAlarm(symbol)=>
    status = close
    var string message = na
    alarmMessageJSON = syminfo.ticker + message +"\\n" + "Price: " + str.tostring(status)

if long
    // Open Long position
    strategy.entry("Long", strategy.long)
    strategy.exit("Long Exit", from_entry="Long", stop=math.max(long_sl, long_atr_stop), limit=long_tp)


if short
    // Open Short position
    strategy.entry("Short", strategy.short)
    strategy.exit("Short Exit", from_entry="Short", stop=math.min(short_sl, short_atr_stop), limit=short_tp)


// **Coloring the candles (BUY = Green, SELL = Red)**
barcolor(long ? color.green : short ? color.red : na)

// **Add entry/exit markers on the chart**
plotshape(long, title="BUY Signal", location=location.belowbar, color=color.green, style=shape.triangleup, size=size.small, text="BUY")
plotshape(short, title="SELL Signal", location=location.abovebar, color=color.red, style=shape.triangledown, size=size.small, text="SELL")

// **Plot TP and SL markers on exits**
exitLong = strategy.position_size < strategy.position_size[1] and strategy.position_size[1] > 0
exitShort = strategy.position_size > strategy.position_size[1] and strategy.position_size[1] < 0

plotshape(exitLong, title="Long Exit", location=location.abovebar, color=color.blue, style=shape.labeldown, size=size.tiny, text="TP/SL")
plotshape(exitShort, title="Short Exit", location=location.belowbar, color=color.orange, style=shape.labelup, size=size.tiny, text="TP/SL")

// **Add alerts**
alertcondition(long, title="Long Signal", message="Long signal triggered!")
alertcondition(short, title="Short Signal", message="Short signal triggered!")
相关推荐