
8
关注
1365
关注者
数字货币期货多品种ATR策略(教学)
创建于 2022-01-07 11:11:54 更新于 2023-09-15 20:54:33
0
3150

数字货币期货多品种ATR策略(教学)
近来,有平台用户十分期望可以移植一个麦语言策略为JavaScript策略,这样就可以灵活的增加很多优化思路。甚至把策略扩展至多品种的版本。因为麦语言策略通常为趋势策略,并且很多是以收盘价模型执行。策略请求交易所API接口并不是很频繁,算是比较合适移植成多品种的策略版本。本篇我们就以一个简单的麦语言策略为例子,移植成一个JavaScript语言的简单版本。主要目的为教学,回测研究。如果要实盘可能还需要一些细节添加(下单价格、量精度,下单量控制,按资产百分比下单,状态信息显示等),并且也要实盘测试。
要移植的麦语言策略
TR:=MAX(MAX((H-L),ABS(REF(C,1)-H)),ABS(REF(C,1)-L));
ATR:=EMA(TR,LENGTH2);
MIDLINE^^EMA((H + L + C)/3,LENGTH1);
UPBAND^^MIDLINE + N*ATR;
DOWNBAND^^MIDLINE - N*ATR;
BKVOL=0 AND C>=UPBAND AND REF(C,1)<REF(UPBAND,1),BPK;
SKVOL=0 AND C<=DOWNBAND AND REF(C,1)>REF(DOWNBAND,1),SPK;
BKVOL>0 AND C<=MIDLINE,SP(BKVOL);
SKVOL>0 AND C>=MIDLINE,BP(SKVOL);
// 止损
// stop loss
C>=SKPRICE*(1+SLOSS*0.01),BP;
C<=BKPRICE*(1-SLOSS*0.01),SP;
AUTOFILTER;
这个策略交易逻辑很简单,首先根据参数计算ATR,然后计算所有K线BAR的最高、最低、收盘价格的均值,根据这些均值数据求出EMA指标。最后结合ATR、参数中的系数N。算出上下轨(upBand,downBand)。
开仓、反手就以收盘价突破上下轨为依据。突破上轨反手(持有空头持仓时)开多,突破下轨反手开空。
当收盘价抵达中线则平仓,收盘价到达止损价格也平仓(根据SLOSS止损,SLOSS是1就是0.01,即为1%)。
策略以收盘价模型执行。
OK,明白了麦语言的策略需求、思路,那么我们就可以动手移植了。
移植、设计策略原型
策略原型代码并不多1~200行,为了方便学习策略的编写思路,直接把注释写在策略代码里。
// 解析params参数,从字符串解析为对象
var arrParam = JSON.parse(params)
// 该函数创建图表配置
function createChartConfig(symbol, atrPeriod, emaPeriod, index) { // symbol : 交易对, atrPeriod : ATR参数周期 , emaPeriod : EMA参数周期 , index 对应的交易所对象索引
var chart = {
__isStock: true,
extension: {
layout: 'single',
height: 600,
},
title : { text : symbol},
xAxis: { type: 'datetime'},
series : [
{
type: 'candlestick', // K线数据系列
name: symbol,
id: symbol + "-" + index,
data: []
}, {
type: 'line', // EMA
name: symbol + ',EMA:' + emaPeriod,
data: [],
}, {
type: 'line', // upBand
name: symbol + ',upBand' + atrPeriod,
data: []
}, {
type: 'line', // downBand
name: symbol + ',downBand' + atrPeriod,
data: []
}, {
type: 'flags',
onSeries: symbol + "-" + index,
data: [],
}
]
}
return chart
}
// 主要逻辑
function process(e, kIndex, c) { // e 即交易所对象,exchanges[0] ... , kIndex K线数据在图表中的数据系列, c 为图表对象
// 获取K线数据
var r = e.GetRecords(e.param.period)
if (!r || r.length < e.param.atrPeriod + 2 || r.length < e.param.emaPeriod + 2) {
// K线数据长度不足则返回
return
}
// 计算ATR指标
var atr = TA.ATR(r, e.param.atrPeriod)
var arrAvgPrice = []
_.each(r, function(bar) {
arrAvgPrice.push((bar.High + bar.Low + bar.Close) / 3)
})
// 计算EMA指标
var midLine = TA.EMA(arrAvgPrice, e.param.emaPeriod)
// 计算上下轨
var upBand = []
var downBand = []
_.each(midLine, function(mid, index) {
if (index < e.param.emaPeriod - 1 || index < e.param.atrPeriod - 1) {
upBand.push(NaN)
downBand.push(NaN)
return
}
upBand.push(mid + e.param.trackRatio * atr[index])
downBand.push(mid - e.param.trackRatio * atr[index])
})
// 画图
for (var i = 0 ; i < r.length ; i++) {
if (r[i].Time == e.state.lastBarTime) {
// 更新
c.add(kIndex, [r[i].Time, r[i].Open, r[i].High, r[i].Low, r[i].Close], -1)
c.add(kIndex + 1, [r[i].Time, midLine[i]], -1)
c.add(kIndex + 2, [r[i].Time, upBand[i]], -1)
c.add(kIndex + 3, [r[i].Time, downBand[i]], -1)
} else if (r[i].Time > e.state.lastBarTime) {
// 添加
e.state.lastBarTime = r[i].Time
c.add(kIndex, [r[i].Time, r[i].Open, r[i].High, r[i].Low, r[i].Close])
c.add(kIndex + 1, [r[i].Time, midLine[i]])
c.add(kIndex + 2, [r[i].Time, upBand[i]])
c.add(kIndex + 3, [r[i].Time, downBand[i]])
}
}
// 检测持仓
var pos = e.GetPosition()
if (!pos) {
return
}
var holdAmount = 0
var holdPrice = 0
if (pos.length > 1) {
throw "同时检测到多空持仓!"
} else if (pos.length != 0) {
holdAmount = pos[0].Type == PD_LONG ? pos[0].Amount : -pos[0].Amount
holdPrice = pos[0].Price
}
if (e.state.preBar == -1) {
e.state.preBar = r[r.length - 1].Time
}
// 检测信号
if (e.state.preBar != r[r.length - 1].Time) { // 收盘价模型
if (holdAmount <= 0 && r[r.length - 3].Close < upBand[upBand.length - 3] && r[r.length - 2].Close > upBand[upBand.length - 2]) { // 收盘价上穿上轨
if (holdAmount < 0) { // 持有空仓,平仓
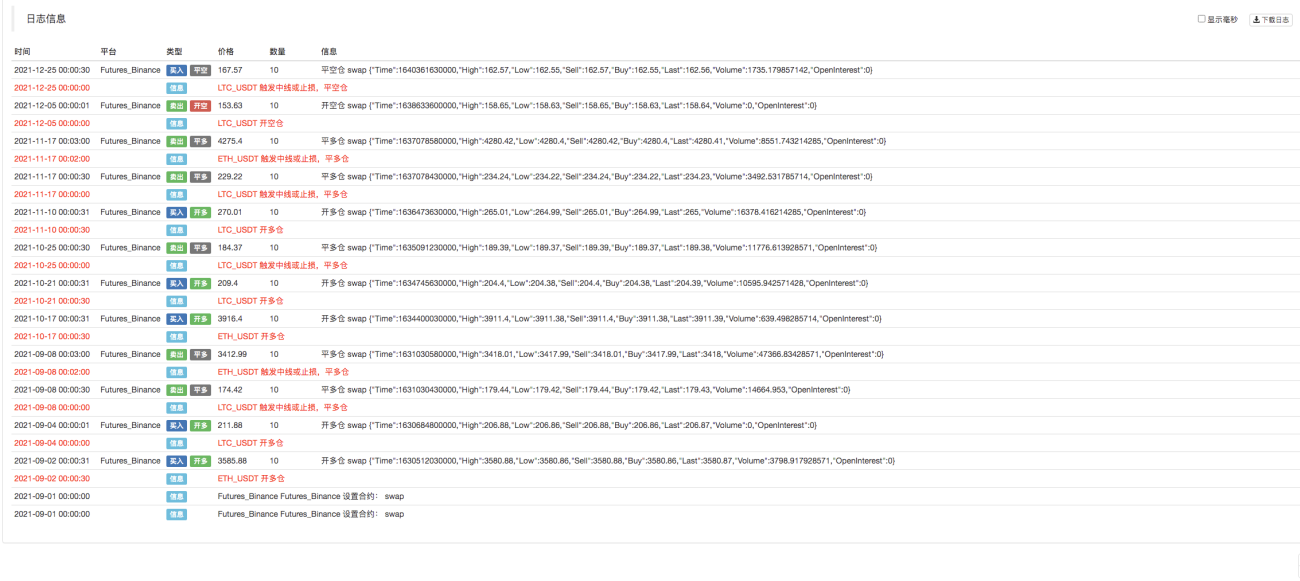
Log(e.GetCurrency(), "平空仓", "#FF0000")
$.CoverShort(e, e.param.symbol, Math.abs(holdAmount))
c.add(kIndex + 4, {x: r[r.length - 2].Time, color: 'red', shape: 'flag', title: '平', text: "平空仓"})
}
// 开多
Log(e.GetCurrency(), "开多仓", "#FF0000")
$.OpenLong(e, e.param.symbol, 10)
c.add(kIndex + 4, {x: r[r.length - 2].Time, color: 'red', shape: 'flag', title: '多', text: "开多仓"})
} else if (holdAmount >= 0 && r[r.length - 3].Close > downBand[downBand.length - 3] && r[r.length - 2].Close < downBand[downBand.length - 2]) { // 收盘价下穿下轨
if (holdAmount > 0) { // 持有多仓,平仓
Log(e.GetCurrency(), "平多仓", "#FF0000")
$.CoverLong(e, e.param.symbol, Math.abs(holdAmount))
c.add(kIndex + 4, {x: r[r.length - 2].Time, color: 'green', shape: 'flag', title: '平', text: "平多仓"})
}
// 开空
Log(e.GetCurrency(), "开空仓", "#FF0000")
$.OpenShort(e, e.param.symbol, 10)
c.add(kIndex + 4, {x: r[r.length - 2].Time, color: 'green', shape: 'flag', title: '空', text: "开空仓"})
} else {
// 平仓
if (holdAmount > 0 && (r[r.length - 2].Close <= holdPrice * (1 - e.param.stopLoss) || r[r.length - 2].Close <= midLine[midLine.length - 2])) { // 持多仓,收盘价小于等于中线,按开仓价格止损
Log(e.GetCurrency(), "触发中线或止损,平多仓", "#FF0000")
$.CoverLong(e, e.param.symbol, Math.abs(holdAmount))
c.add(kIndex + 4, {x: r[r.length - 2].Time, color: 'green', shape: 'flag', title: '平', text: "平多仓"})
} else if (holdAmount < 0 && (r[r.length - 2].Close >= holdPrice * (1 + e.param.stopLoss) || r[r.length - 2].Close >= midLine[midLine.length - 2])) { // 持空仓,收盘价大于等于中线,按开仓价格止损
Log(e.GetCurrency(), "触发中线或止损,平空仓", "#FF0000")
$.CoverShort(e, e.param.symbol, Math.abs(holdAmount))
c.add(kIndex + 4, {x: r[r.length - 2].Time, color: 'red', shape: 'flag', title: '平', text: "平空仓"})
}
}
e.state.preBar = r[r.length - 1].Time
}
}
function main() {
var arrChartConfig = []
if (arrParam.length != exchanges.length) {
throw "参数和交易所对象不匹配!"
}
var arrState = _G("arrState")
_.each(exchanges, function(e, index) {
if (e.GetName() != "Futures_Binance") {
throw "不支持该交易所!"
}
e.param = arrParam[index]
e.state = {lastBarTime: 0, symbol: e.param.symbol, currency: e.GetCurrency()}
if (arrState) {
if (arrState[index].symbol == e.param.symbol && arrState[index].currency == e.GetCurrency()) {
Log("恢复:", e.state)
e.state = arrState[index]
} else {
throw "恢复的数据和当前设置不匹配!"
}
}
e.state.preBar = -1 // 初始设置-1
e.SetContractType(e.param.symbol)
Log(e.GetName(), e.GetLabel(), "设置合约:", e.param.symbol)
arrChartConfig.push(createChartConfig(e.GetCurrency(), e.param.atrPeriod, e.param.emaPeriod, index))
})
var chart = Chart(arrChartConfig)
chart.reset()
while (true) {
_.each(exchanges, function(e, index) {
process(e, index + index * 4, chart)
Sleep(500)
})
}
}
function onexit() {
// 记录 e.state
var arrState = []
_.each(exchanges, function(e) {
arrState.push(e.state)
})
Log("记录:", arrState)
_G("arrState", arrState)
}
策略参数:
            var params = '[{
        "symbol" : "swap",    // 合约代码
        "period" : 86400,     // K线周期,86400秒即为一天
        "stopLoss" : 0.07,    // 止损系数,0.07即7%
        "atrPeriod" : 10,     // ATR指标参数
        "emaPeriod" : 10,     // EMA指标参数
        "trackRatio" : 1,     // 上下轨系数
        "openRatio" : 0.1     // 预留的开仓百分比,暂时没支持
    }, {
        "symbol" : "swap",
        "period" : 86400,
        "stopLoss" : 0.07,
        "atrPeriod" : 10,
        "emaPeriod" : 10,
        "trackRatio" : 1,
        "openRatio" : 0.1
    }]'
回测测试
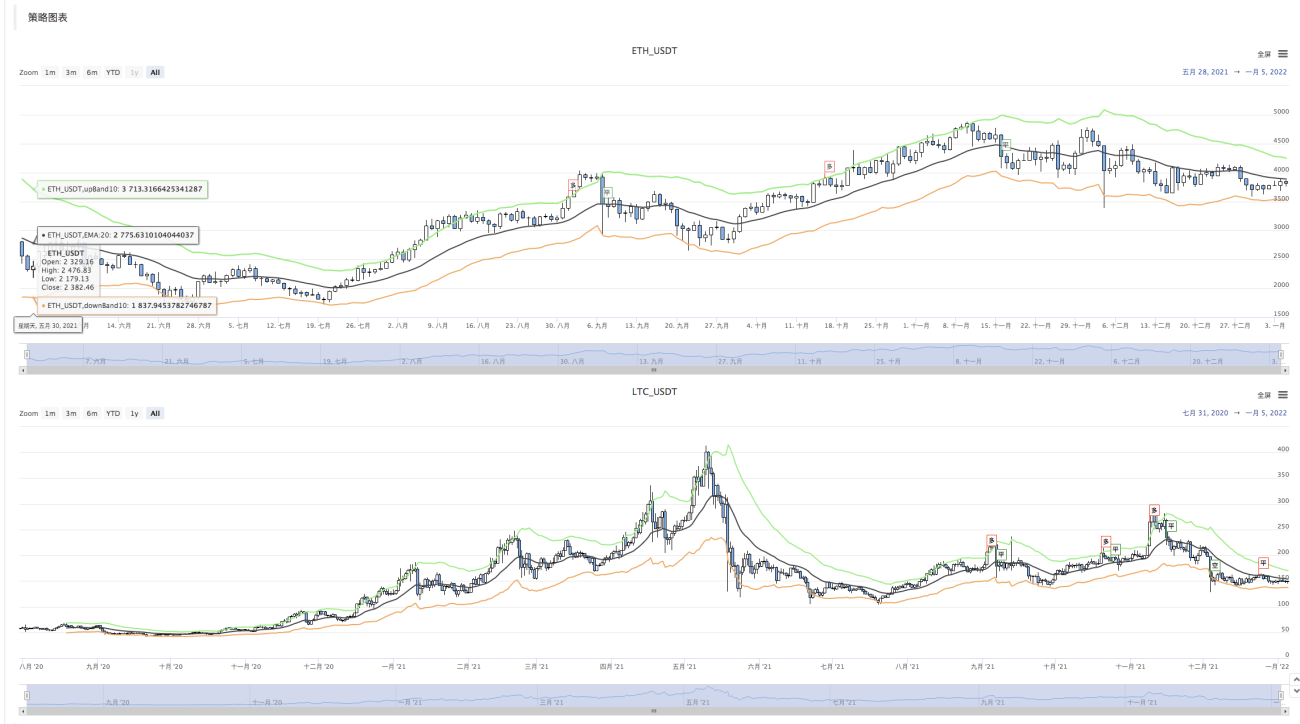
策略源码:https://www.fmz.com/strategy/339344
策略仅供回测、学习研究。实盘请自行修改、优化、参考。
相关推荐
评论
全部评论 (0)
暂无数据
- 1