কৌশল অঙ্কন নকশা সহজ করতে KLineChart ফাংশন ব্যবহার করুন
লেখক:ছোট্ট স্বপ্ন, সৃষ্টিঃ ২০২২-০৭-০৫ 15:13:55, আপডেটঃ ২০২৩-০৯-২৫ 19:49:32
কৌশল অঙ্কন নকশা সহজ করতে KLineChart ফাংশন ব্যবহার করুন
একটি কৌশল ডিজাইন করার সময়, প্রদর্শনের জন্য একটি কৌশল চার্ট ডিজাইন করা প্রায়শই প্রয়োজনীয় হয়, জাভাস্ক্রিপ্ট ভাষা, পাইথন ভাষায় কৌশল লেখার সময়, প্রোগ্রামিং বা এফএমজেড প্ল্যাটফর্মে ব্যবহৃত চার্টিং লাইব্রেরির সাথে অপরিচিত ব্যবহারকারীরা প্রায়শই কাস্টম চার্টে অঙ্কনের জন্য কোড ডিজাইনের সাথে লড়াই করে। সুতরাং আপনি কীভাবে কেবলমাত্র অল্প পরিমাণে কোড দিয়ে সমৃদ্ধ সামগ্রী সহ একটি কৌশল চার্ট আঁকতে পারেন?
এই সহজ এবং শক্তিশালী উপায় অঙ্কন পাইন ভাষায় দেখা যায়, যা তার সমৃদ্ধ অঙ্কন ফাংশন জন্য পরিচিত হয়। যদি পাইন ভাষা অঙ্কন ইন্টারফেস জাভাস্ক্রিপ্ট এবং পাইথন ভাষার কৌশলগুলির সাথে সংযুক্ত করা যেতে পারে, এটি বিকাশকারীদের নকশা কৌশল অঙ্কন ফাংশনকে ব্যাপকভাবে সহজতর করবে। অতএব, এই চাহিদার ভিত্তিতে, এফএমজেড প্ল্যাটফর্ম কাস্টম অঙ্কন ফাংশন আপগ্রেড করেছে এবং ব্যবহারের উপায় প্রসারিত করেছেKLineChartকাস্টম চার্ট আঁকা ফাংশন। আপনি এপিআই ডকুমেন্টেশন পড়ুন পারেনঃhttps://www.fmz.com/api#klinechart
আসুন একটি সহজ উদাহরণ দিয়ে শুরু করা যাক যা জাভাস্ক্রিপ্ট ভাষা ব্যবহার করে ট্রানজিশনের জন্য।
সহজ উদাহরণ
/*backtest
start: 2022-03-21 09:00:00
end: 2022-06-21 15:00:00
period: 30m
basePeriod: 15m
exchanges: [{"eid":"Binance","currency":"BTC_USDT"}]
*/

function main() {
    var c = KLineChart()
    while (true) {
        var bars = _C(exchange.GetRecords)
        for (var i = 0 ; i < bars.length ; i++) {
            var bar = bars[i]
            c.begin(bar)
            c.plot(bar.Volume, "Close")
            c.close()
        }
        Sleep(1000)
    }
}
এই উদাহরণটি খুব সহজ, শুধু কৌশল কাস্টম অঙ্কন এলাকায় একটি কে-লাইন চার্ট আঁকা, এবং চার্টের উপ-চার্ট অবস্থানে প্রতিটি কে-লাইন BAR এর সাথে সামঞ্জস্যপূর্ণ একটি ভলিউম বক্ররেখা আঁকা।
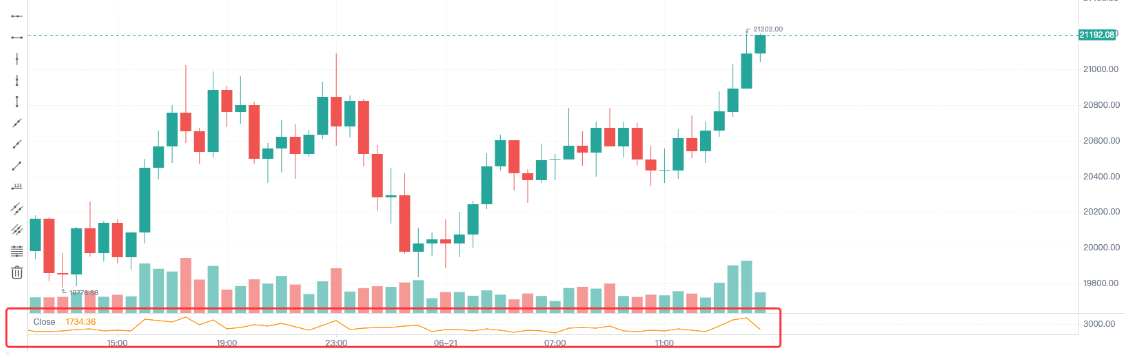
কোডে, আমরা ব্যবহার করিvar c = KLineChart()একটি চার্ট অবজেক্ট তৈরি করার জন্য প্রথমে, এবং তারপর একটি চার্ট আঁকতে তার পদ্ধতি ব্যবহার করুন। তারপর লুপে, আমরা কে-লাইন ডেটা (অ্যারে কাঠামো) পাই, এবং কে-লাইন অ্যারেটি অতিক্রম করি। এটি উদাহরণে যেমন একটি সহজ জন্য লুপ ব্যবহার করে অতিক্রম করা যেতে পারে, অথবা এটি অন্যান্য উপায়ে অতিক্রম করা যেতে পারে।
অঙ্কন অপারেশনc.begin(bar)ফাংশন এবং শেষc.close()ফাংশন।beginএবংcloseফাংশন চার্ট বস্তুর সব পদ্ধতি হয় c. পরবর্তী, সবচেয়ে সাধারণভাবে ব্যবহৃত অঙ্কন ফাংশন ব্যবহার করুনplotপ্রতিটি BAR এর উপর ভলিউম কার্ভ আঁকা।
আরো জটিল উদাহরণ
ধরুন আমরা একটি চার্ট ডিজাইন করতে চাই যার সাথে বোলিংজার ইন্ডিকেটর সংযুক্ত আছে। এবং এটি প্রতিটি BAR এর ভলিউম চার্ট দিয়ে আসে, যা এইভাবে ডিজাইন করা যেতে পারেঃ
/*backtest
start: 2022-03-21 09:00:00
end: 2022-06-21 15:00:00
period: 1d
basePeriod: 1h
exchanges: [{"eid":"Binance","currency":"BTC_USDT"}]
*/

function main() {
    var c = KLineChart()

    // main strategy loop
    while(true) {
        // polling interval
        Sleep(500)

        // get K-line data
        let bars = exchange.GetRecords()
        if (!bars || bars.length <= 20) {
            continue
        }

        // calculate the Bollinger indicator
        var boll = TA.BOLL(bars)

        bars.forEach(function(bar, index) {
            c.begin(bar)
            // drawing operation
            c.plot(boll[0][index], "Boll_Up", {overlay: true})     // Draw on the main chart
            c.plot(boll[1][index], "Boll_Mid", {overlay: true})    // Draw on the main chart
            c.plot(boll[2][index], "Boll_Down", {overlay: true})   // Draw on the main chart
            c.plot(bar.Volume, "volume")                           // Draw on the sub-chart
            c.close()
        })

        // Strategy trading logic
        // ...
        // ..
    }
}
যেমন আমরা কোডে দেখতে পাচ্ছি, আমাদের ব্যাকটেস্ট কনফিগারেশন তথ্য FMZ প্ল্যাটফর্মেঃ
/*backtest
start: 2022-03-21 09:00:00
end: 2022-06-21 15:00:00
period: 1d
basePeriod: 1h
exchanges: [{"eid":"Binance","currency":"BTC_USDT"}]
*/
এই ধরনের একটি কনফিগারেশন হ'ল বাইনারেন্স স্পট এক্সচেঞ্জ অবজেক্ট ব্যাকটেস্টিং পরীক্ষা ব্যবহার করা। ব্যাকটেস্টিং প্রভাবটি নিম্নরূপ দেখানো হয়েছেঃ
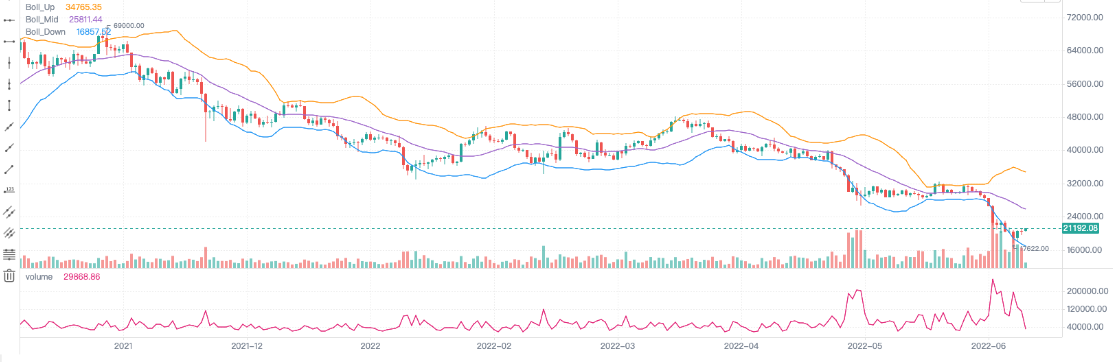
আপনি দেখতে পাচ্ছেন যে আমরা পাইন এর অঙ্কন পদ্ধতি ব্যবহার করছি, যা জাভাস্ক্রিপ্ট ভাষায় অঙ্কন কোডকে ব্যাপকভাবে সহজ করে।
চার্ট আঁকার জন্য সূচক এবং অন্যান্য তথ্য লিখুন
প্ল্যাটফর্ম স্ট্র্যাটেজি স্কয়ারের কৌশল উদাহরণ এবং এপিআই ডকুমেন্টেশনে কে-লাইন ডেটা এবং গণনা সূচকগুলি প্রাপ্ত করার ক্রিয়াকলাপগুলি সাধারণ এবং সহজ।
        // obtain K-line data
        let bars = exchange.GetRecords()
        if (!bars || bars.length <= 20) {
            // If the acquisition of the K line fails, that is, if !bar is true, execute continue, ignore the following code, and re-execute the loop
            // If bars.length is less than or equal to 20, that is, the number of K-line BAR (bar) is less than 20, the indicator cannot be calculated, and continue is also executed
            continue
        }

        // Calculate the Bollinger indicator
        var boll = TA.BOLL(bars)
Bollinger সূচক গণনা ফাংশন TA.BOLL, যদি Bollinger সূচক পরামিতি নির্দিষ্ট করা হয় না, ডিফল্ট পরামিতিBOLL(20, 2)বোলিংজার সূচকটিতে তিনটি লাইন রয়েছে, তাই TA.BOLL ফাংশন দ্বারা প্রদত্ত ডেটা একটি দ্বি-মাত্রিক অ্যারে। বোল[০], বোল[1], এবং বোল[2] হল বোল অ্যারের তিনটি উপাদান, যার প্রতিটি একটি লাইন উপস্থাপন করে এবং একটি অ্যারে।
- boll[0]: Bollinger Bands আপ লাইন
- বোল [1]: বোলিংজার ব্যান্ডস মিডলাইন
- boll[2]: বোলিংজার ব্যান্ডস ডাউন লাইন
তারপর আমরা দেখব কিভাবে K-লাইন ডেটার ভলিউম, অর্থাৎ ভলিউম, এবং গণনা করা Bollinger সূচক ডেটা চার্টে আঁকতে হয়।
আমরা K-লাইন ডেটা বার দ্বারা বার আঁকা, তাই আমরা সমগ্র K-লাইন অ্যারে অতিক্রম করতে হবে, অর্থাৎ, কোড মধ্যে বার অ্যারে অতিক্রম.forEachপদ্ধতিটি এখানে ক্রস করতে ব্যবহৃত হয়, অথবা for লুপটি ক্রস করতে ব্যবহার করা যেতে পারে।
        bars.forEach(function(bar, index) {
            c.begin(bar)
            // Drawing operations
            c.plot(boll[0][index], "Boll_Up", {overlay: true})     // {overlay: true} Parameter control, drawn on the main chart
            c.plot(boll[1][index], "Boll_Mid", {overlay: true})    // Draw on the main chart
            c.plot(boll[2][index], "Boll_Down", {overlay: true})   // Draw on the main chart
            c.plot(bar.Volume, "volume")                           // Draw on the sub-chart
            c.close()
        })
এটা লক্ষ করা উচিত যে যখনই আপনি একটি বারে একটি চার্ট অঙ্কন অপারেশন শুরু, আপনি একটিc.begin(bar)ফাংশন কল প্রথম.beginফাংশন আমাদের চার্ট বস্তু সি পদ্ধতির একটি। অঙ্কন অপারেশন শেষে,c.close()ডাকা প্রয়োজন.beginফাংশন এবংcloseফাংশন হল অঙ্কন ফাংশন যা আমরা পাইন ভাষার অঙ্কন পদ্ধতির অনুরূপ বলি। এটি সমর্থন করেঃbarcolor bgcolor plot fill hline plotarrow plotshape plotchar plotcandle signal, আপনি লাইন, তীরচিহ্ন, চিহ্নিত তথ্য ইত্যাদি আঁকতে পারেন। এই ফাংশনগুলির পরামিতিগুলি পাইন ভাষার সাথে সম্পর্কিত ফাংশন পরামিতিগুলির সাথে একই, এবং অঙ্কন ফাংশনগুলিও একই।
ট্রেডিং সিগন্যাল তীর, মার্কার, অনুভূমিক রেখা ইত্যাদি আঁকা যোগ করুন।
উপরের বোলিংজার ব্যান্ড চার্ট উদাহরণে কিছু ট্রেডিং সিগন্যাল তীর, মার্কার, অনুভূমিক রেখা যোগ করুন।
/*backtest
start: 2022-03-21 09:00:00
end: 2022-06-21 15:00:00
period: 1d
basePeriod: 1h
exchanges: [{"eid":"Binance","currency":"BTC_USDT"}]
*/

function main() {
    var c = KLineChart({overlay : true})

    // Strategy main loop
    while(true) {
        // Polling interval
        Sleep(500)

        // Obtain K-line data
        let bars = exchange.GetRecords()
        if (!bars || bars.length <= 20) {
            continue
        }

        // Calculate Bollinger indicator
        var boll = TA.BOLL(bars)

        bars.forEach(function(bar, index) {
            c.begin(bar)
            // Drawing operations
            c.plot(boll[0][index], "Boll_Up", {overlay: true})     // Draw on the main chart
            c.plot(boll[1][index], "Boll_Mid", {overlay: true})    // Draw on the main chart
            c.plot(boll[2][index], "Boll_Down", {overlay: true})   // Draw on the main chart
            c.plot(bar.Volume, "volume", {overlay: false})         // Draw on the sub-chart

            c.hline(bar.Open, {overlay: true})                          // Horizontal line
            c.plotarrow(bar.Close - bar.Open, {overlay: true})          // Arrow
            c.plotshape(bar.Close - bar.Open > 0, {style: 'square'})    // Draw square markers
            c.plotchar(bar.Close - bar.Open < 0, {char: 'X'})           // Draw the character X

            c.close()
        })

        // Strategy trading logic
        // ...
        // ..
    }
}

চার্ট কনফিগারেশন বস্তু
চার্ট স্টাইল কনফিগার করার জন্য একটি কাঠামো ঘোষণা করা যেতে পারে। উদাহরণস্বরূপ, নিম্নলিখিত চার্টCfg পরিবর্তনশীল একটি গ্রিড লাইনের কনফিগারেশন তথ্য উপস্থাপন করে।
    var chartCfg = {
        grid: {
            show: true,
            // Grid horizontal line
            horizontal: {
                show: true,
                size: 2,
                color: '#FF0000',    // Color of horizontal grid line
                // 'solid'|'dash'
                style: 'dash',       // Type of line
                dashValue: [2, 2]
            },
   	        // Grid vertical line
            vertical: {
                show: true,
                size: 2,
                color: '#32CD32',
                // 'solid'|'dash'
                style: 'solid',
                dashValue: [2, 2]
            }
        },
    }
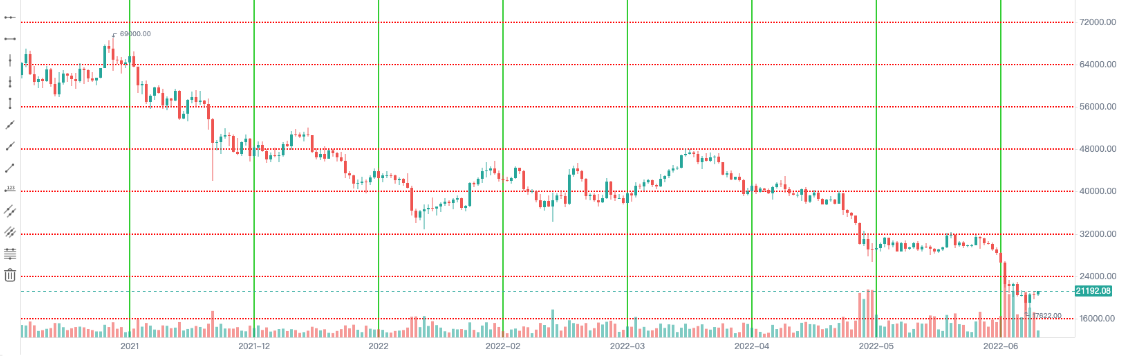
চার্ট কনফিগারেশন অবজেক্ট হ'ল ডেটা কাঠামো যা চার্টের কিছু বৈশিষ্ট্য এবং উপস্থিতি সেট করে। উদাহরণস্বরূপ, উদাহরণে একটি গ্রিড লাইন স্টাইল কনফিগারেশন ব্যবহার করা হয়। এমন অনেকগুলি বিকল্প রয়েছে যা কনফিগার এবং সংশোধন করা যেতে পারে, যেমন এক্স-অক্ষ, ওয়াই-অক্ষ সম্পর্কিত সেটিংস, কার্সার লাইন সেটিংস, সতর্কতা বার্তা সেটিংস, প্রযুক্তিগত সূচক শৈলী সেটিংস, কে-লাইন বার শৈলী সেটিংস ইত্যাদি।
অবশ্যই, যদি আপনি এই সঙ্গে পরিচিত না হন, আপনি চার্ট কনফিগারেশন বস্তু পাস করতে পারবেন না যখন কলKLineChartএকটি চার্ট বস্তু তৈরি করতে ফাংশন. তারপর তৈরি চার্ট ডিফল্ট শৈলী. API ফাংশন ব্যবহার করুনKLineChartএকটি চার্ট অবজেক্ট তৈরি করতে FMZ প্ল্যাটফর্মের ফাংশনঃ
var c = KLineChart(chartCfg)
গ্রিড লাইন আঁকার জন্য পরীক্ষার কোডঃ
/*backtest
start: 2022-03-21 09:00:00
end: 2022-06-21 15:00:00
period: 1d
basePeriod: 1h
exchanges: [{"eid":"Binance","currency":"BTC_USDT"}]
*/

function main() {
    var chartCfg = {
        grid: {
            show: true,
            // Grid horizontal line
            horizontal: {
                show: true,
                size: 2,
                color: '#FF0000',
                // 'solid'|'dash'
                style: 'dash',
                dashValue: [2, 2]
            },
   	        // Grid vertical line
            vertical: {
                show: true,
                size: 2,
                color: '#32CD32',
                // 'solid'|'dash'
                style: 'solid',
                dashValue: [2, 2]
            }
        },
    }

    var c = KLineChart(chartCfg)

    // Strategy main loop
    while(true) {
        // Polling interval
        Sleep(500)

        // Obtain K-line data
        var bars = _C(exchange.GetRecords)
        bars.forEach(function(bar, index) {
            c.begin(bar)
            c.close()
        })

        // Strategy trading logic
        // ...
        // ..
    }
}
চার্ট কনফিগারেশন স্টাইলের উদাহরণ
এটি চার্ট কনফিগারেশন স্টাইল সেটিংস উল্লেখ করতে ব্যবহার করা যেতে পারে।
{
// Gridlines
grid: {
show: true,
// Grid horizontal line
horizontal: {
show: true,
size: 1,
color: '#393939',
// 'solid'|'dash'
style: 'dash',
dashValue: [2, 2]
},
// Grid vertical line
vertical: {
show: false,
size: 1,
color: '#393939',
// 'solid'|'dash'
style: 'dash',
dashValue: [2, 2]
}
},
// Candlestick chart
candle: {
// The distance between the top and bottom of the candlestick chart, greater than 1 is the absolute value, greater than 0, and 1 is the proportion
margin: {
top: 0.2,
bottom: 0.1
},
// Type of Candlestick Charts 'candle_solid'|'candle_stroke'|'candle_up_stroke'|'candle_down_stroke'|'ohlc'|'area'
type: 'candle_solid',
// Candle pillar
bar: {
upColor: '#26A69A',
downColor: '#EF5350',
noChangeColor: '#888888'
},
// Area map
area: {
lineSize: 2,
lineColor: '#2196F3',
value: 'close',
backgroundColor: [{
offset: 0,
color: 'rgba(33, 150, 243, 0.01)'
}, {
offset: 1,
color: 'rgba(33, 150, 243, 0.2)'
}]
},
priceMark: {
show: true,
// Highest price marker
high: {
show: true,
color: '#D9D9D9',
textMargin: 5,
textSize: 10,
textFamily: 'Helvetica Neue',
textWeight: 'normal'
},
// Lowest price marker
low: {
show: true,
color: '#D9D9D9',
textMargin: 5,
textSize: 10,
textFamily: 'Helvetica Neue',
textWeight: 'normal',
},
// Latest price marker
last: {
show: true,
upColor: '#26A69A',
downColor: '#EF5350',
noChangeColor: '#888888',
line: {
show: true,
// 'solid'|'dash'
style: 'dash',
dashValue: [4, 4],
size: 1
},
text: {
show: true,
size: 12,
paddingLeft: 2,
paddingTop: 2,
paddingRight: 2,
paddingBottom: 2,
color: '#FFFFFF',
family: 'Helvetica Neue',
weight: 'normal',
borderRadius: 2
}
}
},
// Tips
tooltip: {
// 'always' | 'follow_cross' | 'none'
showRule: 'always',
// 'standard' | 'rect'
showType: 'standard',
labels: ['time', 'open', 'close', 'high', 'low', 'volume'],
values: null,
defaultValue: 'n/a',
rect: {
paddingLeft: 0,
paddingRight: 0,
paddingTop: 0,
paddingBottom: 6,
offsetLeft: 8,
offsetTop: 8,
offsetRight: 8,
borderRadius: 4,
borderSize: 1,
borderColor: '#3f4254',
backgroundColor: 'rgba(17, 17, 17, .3)'
},
text: {
size: 12,
family: 'Helvetica Neue',
weight: 'normal',
color: '#D9D9D9',
marginLeft: 8,
marginTop: 6,
marginRight: 8,
marginBottom: 0
}
}
},
// Technical indicators
technicalIndicator: {
margin: {
top: 0.2,
bottom: 0.1
},
bar: {
upColor: '#26A69A',
downColor: '#EF5350',
noChangeColor: '#888888'
},
line: {
size: 1,
colors: ['#FF9600', '#9D65C9', '#2196F3', '#E11D74', '#01C5C4']
},
circle: {
upColor: '#26A69A',
downColor: '#EF5350',
noChangeColor: '#888888'
},
// Latest value marker
lastValueMark: {
show: false,
text: {
show: false,
color: '#ffffff',
size: 12,
family: 'Helvetica Neue',
weight: 'normal',
paddingLeft: 3,
paddingTop: 2,
paddingRight: 3,
paddingBottom: 2,
borderRadius: 2
}
},
// Tips
tooltip: {
// 'always' | 'follow_cross' | 'none'
showRule: 'always',
// 'standard' | 'rect'
showType: 'standard',
showName: true,
showParams: true,
defaultValue: 'n/a',
text: {
size: 12,
family: 'Helvetica Neue',
weight: 'normal',
color: '#D9D9D9',
marginTop: 6,
marginRight: 8,
marginBottom: 0,
marginLeft: 8
}
}
},
// x-axis
xAxis: {
show: true,
height: null,
// x-axis line
axisLine: {
show: true,
color: '#888888',
size: 1
},
// x-axis split text
tickText: {
show: true,
color: '#D9D9D9',
family: 'Helvetica Neue',
weight: 'normal',
size: 12,
paddingTop: 3,
paddingBottom: 6
},
// x-axis split line
tickLine: {
show: true,
size: 1,
length: 3,
color: '#888888'
}
},
// y-axis
yAxis: {
show: true,
width: null,
// 'left' | 'right'
position: 'right',
// 'normal' | 'percentage' | 'log'
type: 'normal',
inside: false,
reverse: false,
// y-axis line
axisLine: {
show: true,
color: '#888888',
size: 1
},
// y-axis split text
tickText: {
show: true,
color: '#D9D9D9',
family: 'Helvetica Neue',
weight: 'normal',
size: 12,
paddingLeft: 3,
paddingRight: 6
},
// y-axis split line
tickLine: {
show: true,
size: 1,
length: 3,
color: '#888888'
}
},
// Split line between charts
separator: {
size: 1,
color: '#888888',
fill: true,
activeBackgroundColor: 'rgba(230, 230, 230, .15)'
},
// Crosshair
crosshair: {
show: true,
// Horizontal line and text of crosshair
horizontal: {
show: true,
line: {
show: true,
// 'solid'|'dash'
style: 'dash',
dashValue: [4, 2],
size: 1,
color: '#888888'
},
text: {
show: true,
color: '#D9D9D9',
size: 12,
family: 'Helvetica Neue',
weight: 'normal',
paddingLeft: 2,
paddingRight: 2,
paddingTop: 2,
paddingBottom: 2,
borderSize: 1,
borderColor: '#505050',
borderRadius: 2,
backgroundColor: '#505050'
}
},
// Vertical line and text of crosshair
vertical: {
show: true,
line: {
show: true,
// 'solid'|'dash'
style: 'dash',
dashValue: [4, 2],
size: 1,
color: '#888888'
},
text: {
show: true,
color: '#D9D9D9',
size: 12,
family: 'Helvetica Neue',
weight: 'normal',
paddingLeft: 2,
paddingRight: 2,
paddingTop: 2,
paddingBottom: 2,
borderSize: 1,
borderColor: '#505050',
borderRadius: 2,
backgroundColor: '#505050'
}
}
},
// Graph
shape: {
point: {
backgroundColor: '#2196F3',
borderColor: '#2196F3',
borderSize: 1,
radius: 4,
activeBackgroundColor: '#2196F3',
activeBorderColor: '#2196F3',
activeBorderSize: 1,
activeRadius: 6
},
line: {
// 'solid'|'dash'
style: 'solid'
color: '#2196F3',
size: 1,
dashValue: [2, 2]
},
polygon: {
// 'stroke'|'fill'
style: 'stroke',
stroke: {
// 'solid'|'dash'
style: 'solid',
size: 1,
color: '#2196F3',
dashValue: [2, 2]
},
fill: {
color: 'rgba(33, 150, 243, 0.1)'
}
},
arc: {
// 'stroke'|'fill'
style: 'stroke',
stroke: {
// 'solid'|'dash'
style: 'solid',
size: 1,
color: '#2196F3',
dashValue: [2, 2]
},
fill: {
color: '#2196F3'
}
},
text: {
style: 'fill',
color: '#2196F3',
size: 12,
family: 'Helvetica Neue',
weight: 'normal',
offset: [0, 0]
}
},
annotation: {
// 'top' | 'bottom' | 'point'
position: 'top',
offset: [20, 0]
symbol: {
// 'diamond' | 'circle' | 'rect' | 'triangle' | 'custom' | 'none'
type: 'diamond',
size: 8,
color: '#2196F3',
activeSize: 10,
activeColor: '#FF9600'
}
},
tag: {
// 'top' | 'bottom' | 'point'
position: 'point',
offset: 0,
line: {
show: true,
style: LineStyle.DASH,
dashValue: [4, 2],
size: 1,
color: '#2196F3'
},
text: {
color: '#FFFFFF',
backgroundColor: '#2196F3',
size: 12,
family: 'Helvetica Neue',
weight: 'normal',
paddingLeft: 2,
paddingRight: 2,
paddingTop: 2,
paddingBottom: 2,
borderRadius: 2,
borderSize: 1,
borderColor: '#2196F3'
},
mark: {
offset: 0,
color: '#FFFFFF',
backgroundColor: '#2196F3',
size: 12,
family: 'Helvetica Neue',
weight: 'normal',
paddingLeft: 2,
paddingRight: 2,
paddingTop: 2,
paddingBottom: 2,
borderRadius: 2,
borderSize: 1,
borderColor: '#2196F3'
}
}
}
এটি কি কৌশল নকশা নকশা সহজ করে তোলে না?
- ক্রিপ্টোকারেন্সি মার্কেটে মৌলিক বিশ্লেষণের পরিমাণ নির্ধারণঃ তথ্য নিজের জন্য কথা বলতে দিন!
- মুদ্রাচক্রের মৌলিক পরিমাণগত গবেষণা - এখন আর সব ধরনের ধাঁধাবাদী শিক্ষকদের বিশ্বাস করা বন্ধ করুন, তথ্য অবজেক্টিভভাবে কথা বলছে!
- কোয়ালিফাইড লেনদেনের জন্য একটি অপরিহার্য সরঞ্জাম - উদ্ভাবক কোয়ালিফাইড ডেটা এক্সপ্লোরার মডিউল
- সবকিছু আয়ত্ত করা - এফএমজেড ট্রেডিং টার্মিনালের নতুন সংস্করণে ভূমিকা (টিআরবি আর্বিট্রেজ সোর্স কোড সহ)
- এফএমজেডের নতুন ট্রেডিং টার্মিনালের সাথে পরিচিত হোন (ট্র্যাফিক কোড সহ)
- FMZ Quant: ক্রিপ্টোকারেন্সি মার্কেটে সাধারণ প্রয়োজনীয়তা ডিজাইন উদাহরণগুলির বিশ্লেষণ (II)
- কিভাবে 80 লাইন কোডে একটি উচ্চ ফ্রিকোয়েন্সি কৌশল সঙ্গে মস্তিষ্কহীন বিক্রয় বট শোষণ
- এফএমজেড পরিমাণঃ ক্রিপ্টোকারেন্সি বাজারের সাধারণ চাহিদা ডিজাইন উদাহরণ বিশ্লেষণ (২)
- ৮০ লাইন কোডের উচ্চ-প্রবাহের কৌশল ব্যবহার করে মস্তিষ্কবিহীন রোবটকে কীভাবে বিক্রি করা যায়
- FMZ Quant: ক্রিপ্টোকারেন্সি মার্কেটে সাধারণ প্রয়োজনীয়তা ডিজাইন উদাহরণগুলির বিশ্লেষণ (I)
- এফএমজেড কোয়াটিফিকেশনঃ ক্রিপ্টোকারেন্সি মার্কেটের সাধারণ চাহিদা ডিজাইন উদাহরণ বিশ্লেষণ