ইউটিউব ভেটেরান্সের "ম্যাজিক ডাবল ইএমএ স্ট্র্যাটেজি"
লেখক:লিডিয়া, সৃষ্টিঃ ২০২২-১১-০৭ ১২ঃ০২ঃ৩১, আপডেটঃ ২০২৩-০৯-১৫ ২০ঃ৫১ঃ২৩
ইউটিউব ভেটেরান্সের Magic Double EMA Strategy
এই সংখ্যায়, আমরা ইউটিউব থেকে একটি
কৌশল দ্বারা ব্যবহৃত সূচক
- ইএমএ সূচক
ডিজাইনের সরলতার স্বার্থে, আমরা ভিডিওতে তালিকাভুক্ত চলমান গড় এক্সপোনেনশিয়াল ব্যবহার করব না, আমরা পরিবর্তে ট্রেডিং ভিউর অন্তর্নির্মিত ta.ema ব্যবহার করব (এটি আসলে একই) ।
- VuManChu সুইং ফ্রি সূচক
এটি ট্রেডিং ভিউতে একটি সূচক, আমাদের ট্রেডিং ভিউতে যেতে হবে এবং সোর্স কোডটি তুলতে হবে।
ভিউম্যানচু সোয়িং ফ্রি কোডঃ
// This source code is subject to the terms of the Mozilla Public License 2.0 at https://mozilla.org/MPL/2.0/

// Credits to the original Script - Range Filter DonovanWall https://www.tradingview.com/script/lut7sBgG-Range-Filter-DW/
// This version is the old version of the Range Filter with less settings to tinker with

//@version=4
study(title="Range Filter - B&S Signals", shorttitle="RF - B&S Signals", overlay=true)

//-----------------------------------------------------------------------------------------------------------------------------------------------------------------
//Functions
//-----------------------------------------------------------------------------------------------------------------------------------------------------------------

//Range Size Function
rng_size(x, qty, n)=>
//    AC       = Cond_EMA(abs(x - x[1]), 1, n)
    wper      = (n*2) - 1
    avrng     = ema(abs(x - x[1]), n)
    AC = ema(avrng, wper)*qty
    rng_size = AC

//Range Filter Function
rng_filt(x, rng_, n)=>
    r          = rng_
    var rfilt  = array.new_float(2, x)
    array.set(rfilt, 1, array.get(rfilt, 0))
    if x - r > array.get(rfilt, 1)
        array.set(rfilt, 0, x - r)
    if x + r < array.get(rfilt, 1)
        array.set(rfilt, 0, x + r)
    rng_filt1 = array.get(rfilt, 0)

    hi_band   = rng_filt1 + r
    lo_band   = rng_filt1 - r
    rng_filt  = rng_filt1
    [hi_band, lo_band, rng_filt]

//-----------------------------------------------------------------------------------------------------------------------------------------------------------------
//Inputs
//-----------------------------------------------------------------------------------------------------------------------------------------------------------------

//Range Source
rng_src = input(defval=close, type=input.source, title="Swing Source")

//Range Period
rng_per = input(defval=20, minval=1, title="Swing Period")

//Range Size Inputs
rng_qty   = input(defval=3.5, minval=0.0000001, title="Swing Multiplier")

//Bar Colors
use_barcolor = input(defval=false, type=input.bool, title="Bar Colors On/Off")

//-----------------------------------------------------------------------------------------------------------------------------------------------------------------
//Definitions
//-----------------------------------------------------------------------------------------------------------------------------------------------------------------

//Range Filter Values
[h_band, l_band, filt] = rng_filt(rng_src, rng_size(rng_src, rng_qty, rng_per), rng_per)

//Direction Conditions
var fdir = 0.0
fdir    := filt > filt[1] ? 1 : filt < filt[1] ? -1 : fdir
upward   = fdir==1 ? 1 : 0
downward = fdir==-1 ? 1 : 0

//Trading Condition
longCond = rng_src > filt and rng_src > rng_src[1] and upward > 0 or rng_src > filt and rng_src < rng_src[1] and upward > 0
shortCond = rng_src < filt and rng_src < rng_src[1] and downward > 0 or rng_src < filt and rng_src > rng_src[1] and downward > 0

CondIni = 0
CondIni := longCond ? 1 : shortCond ? -1 : CondIni[1]
longCondition = longCond and CondIni[1] == -1
shortCondition = shortCond and CondIni[1] == 1

//Colors
filt_color = upward ? #05ff9b : downward ? #ff0583 : #cccccc
bar_color  = upward and (rng_src > filt) ? (rng_src > rng_src[1] ? #05ff9b : #00b36b) :
             downward and (rng_src < filt) ? (rng_src < rng_src[1] ? #ff0583 : #b8005d) : #cccccc

//-----------------------------------------------------------------------------------------------------------------------------------------------------------------
//Outputs
//-----------------------------------------------------------------------------------------------------------------------------------------------------------------

//Filter Plot
filt_plot = plot(filt, color=filt_color, transp=67, linewidth=3, title="Filter")

//Band Plots
h_band_plot = plot(h_band, color=color.new(#05ff9b, 100), title="High Band")
l_band_plot = plot(l_band, color=color.new(#ff0583, 100), title="Low Band")

//Band Fills
fill(h_band_plot, filt_plot, color=color.new(#00b36b, 92), title="High Band Fill")
fill(l_band_plot, filt_plot, color=color.new(#b8005d, 92), title="Low Band Fill")

//Bar Color
barcolor(use_barcolor ? bar_color : na)

//Plot Buy and Sell Labels
plotshape(longCondition, title = "Buy Signal", text ="BUY", textcolor = color.white, style=shape.labelup, size = size.normal, location=location.belowbar, color = color.new(color.green, 0))
plotshape(shortCondition, title = "Sell Signal", text ="SELL", textcolor = color.white, style=shape.labeldown, size = size.normal, location=location.abovebar, color = color.new(color.red, 0))

//Alerts
alertcondition(longCondition, title="Buy Alert", message = "BUY")
alertcondition(shortCondition, title="Sell Alert", message = "SELL")
কৌশলগত যুক্তি
ইএমএ সূচকঃ কৌশলটি দুটি ইএমএ ব্যবহার করে, একটি দ্রুত লাইন (ছোট সময়ের পরামিতি) এবং অন্যটি ধীর লাইন (বড় সময়ের পরামিতি) । ডাবল ইএমএ চলমান গড়ের উদ্দেশ্য মূলত আমাদের বাজারের প্রবণতার দিক নির্ধারণে সহায়তা করা।
-
লং পজিশনের ব্যবস্থা দ্রুত লাইনটি ধীর লাইনের উপরে।
-
শর্ট পজিশনের ব্যবস্থা দ্রুত লাইনটি ধীর লাইনের নিচে।
VuManChu Swing Free Indicator: VuManChu Swing Free ইন্ডিকেটরটি সংকেত পাঠাতে এবং অন্যান্য শর্তগুলির সাথে একত্রে অর্ডার দেওয়ার বিষয়ে বিচার করার জন্য ব্যবহৃত হয়। এটি VuManChu Swing Free সূচক উত্স কোড থেকে দেখা যায় যে longCondition ভেরিয়েবলটি কেনার সংকেত এবং shortCondition ভেরিয়েবলটি বিক্রয় সংকেতকে উপস্থাপন করে। এই দুটি ভেরিয়েবল অর্ডার দেওয়ার শর্তগুলির পরবর্তী লেখার জন্য ব্যবহৃত হবে।
এখন আসুন ট্রেডিং সিগন্যালের নির্দিষ্ট ট্রিগার শর্ত সম্পর্কে কথা বলি:
-
লং পজিশনে প্রবেশের নিয়মঃ ইতিবাচক কে-লাইনের বন্ধের মূল্য ইএমএর দ্রুত রেখার উপরে হওয়া উচিত, দুটি ইএমএর একটি লং পজিশন হওয়া উচিত (ধীর রেখার উপরে দ্রুত রেখা), এবং ভুম্যানচু সুইং ফ্রি সূচকটি একটি ক্রয় সংকেত প্রদর্শন করা উচিত (longCondition সত্য) । যদি তিনটি শর্ত পূরণ করা হয়, এই কে-লাইনটি লং পজিশনের প্রবেশের জন্য মূল কে-লাইন এবং এই কে-লাইনের বন্ধের দামটি প্রবেশের অবস্থান।
-
শর্ট পজিশনে প্রবেশের নিয়ম (লং পজিশনের বিপরীতে): নেতিবাচক কে-লাইনের বন্ধের মূল্য EMA এর দ্রুত রেখার নীচে হওয়া উচিত, দুটি EMA একটি শর্ট পজিশন হওয়া উচিত (ধীর রেখার নীচে দ্রুত লাইন), এবং VuManChu Swing Free সূচকটি একটি বিক্রয় সংকেত প্রদর্শন করা উচিত (shortCondition সত্য) । যদি তিনটি শর্ত পূরণ করা হয়, তাহলে কে-লাইনের বন্ধের মূল্য হ'ল শর্ট এন্ট্রি পজিশন।
ট্রেডিং লজিক কি খুব সহজ? যেহেতু উত্স ভিডিও লাভ স্টপ এবং ক্ষতি স্টপ নির্দিষ্ট করে না, আমি একটি মাঝারি লাভ স্টপ এবং ক্ষতি স্টপ পদ্ধতি অবাধে ব্যবহার করব, ক্ষতি বন্ধ করতে স্থির পয়েন্ট ব্যবহার করে, এবং লাভ স্টপ ট্র্যাকিং।
কোড ডিজাইন
ভিউম্যানচু সোয়িং ফ্রি সূচকটির কোড আমরা কোন পরিবর্তন ছাড়াই সরাসরি আমাদের কৌশল কোডে রেখেছি।
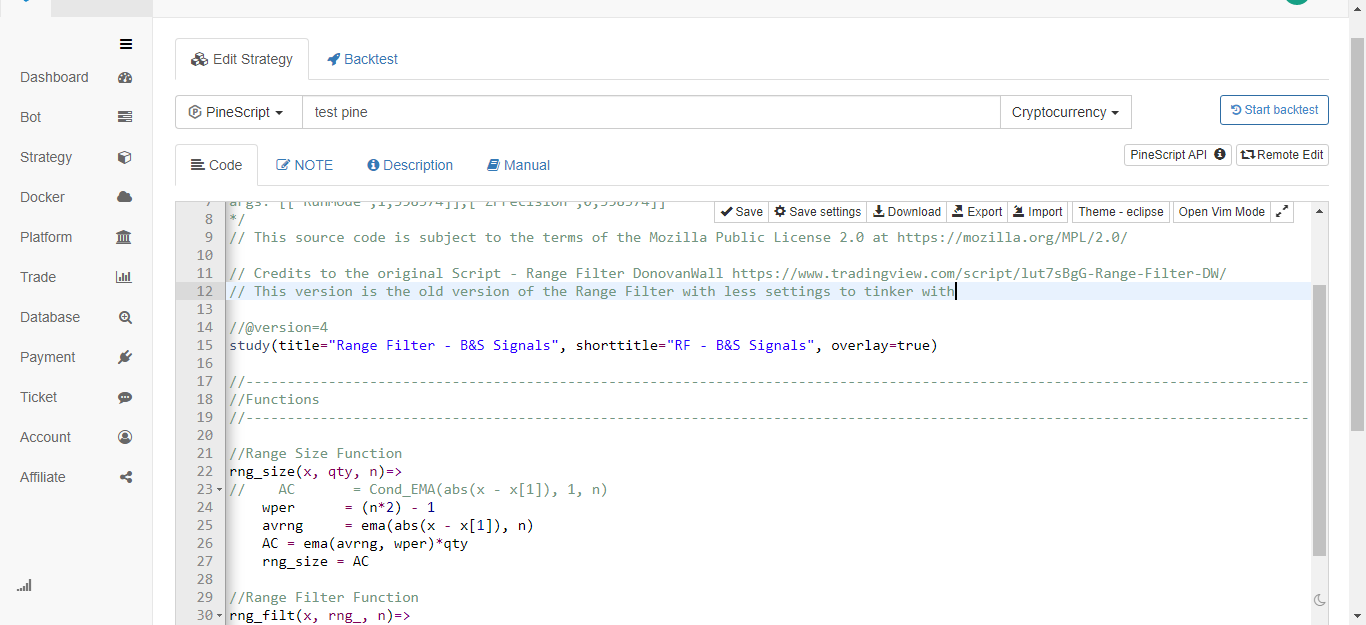
তারপরে আমরা পাইন ভাষার একটি কোড লিখব যা ট্রেডিং ফাংশনটি বাস্তবায়ন করেঃ
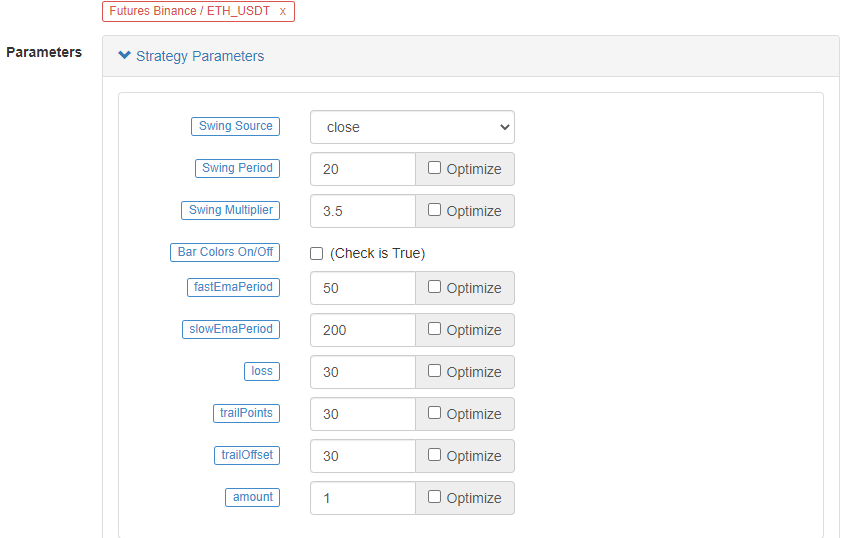
// extend
fastEmaPeriod = input(50, "fastEmaPeriod")         // fast line period
slowEmaPeriod = input(200, "slowEmaPeriod")        // slow line period
loss = input(30, "loss")                           // stop loss points
trailPoints = input(30, "trailPoints")             // number of trigger points for moving stop loss
trailOffset = input(30, "trailOffset")             // moving stop profit offset (points)
amount = input(1, "amount")                        // order amount

emaFast = ta.ema(close, fastEmaPeriod)             // calculate the fast line EMA
emaSlow = ta.ema(close, slowEmaPeriod)             // calculate the slow line EMA

buyCondition = longCondition and emaFast > emaSlow and close > open and close > emaFast         // entry conditions for long positions
sellCondition = shortCondition and emaFast < emaSlow and close < open and close < emaFast       // entry conditions for short positions

if buyCondition and strategy.position_size == 0
    strategy.entry("long", strategy.long, amount)
    strategy.exit("exit_long", "long", amount, loss=loss, trail_points=trailPoints, trail_offset=trailOffset)
if sellCondition and strategy.position_size == 0
    strategy.entry("short", strategy.short, amount)
    strategy.exit("exit_short", "short", amount, loss=loss, trail_points=trailPoints, trail_offset=trailOffset)
A.Itএটা দেখা যায় যে যখন buyCondition সত্য হয়, অর্থাৎঃ
- ভেরিয়েবল longCondition true (VuManChu Swing Free সূচক একটি দীর্ঘ অবস্থানের সংকেত পাঠায়) ।
- emaFast > emaSlow (EMA দীর্ঘ অবস্থানের সমন্বয়) ।
- close > open (বর্তমান BAR ধনাত্মক), close > emaFast (বন্ধের মূল্য EMA fast line এর উপরে) ।
দীর্ঘস্থায়ী হওয়ার জন্য তিনটি শর্ত।
B. যখন sellCondition সত্য হয়, তখন একটি শর্ট পজিশন তৈরির তিনটি শর্ত (এখানে পুনরাবৃত্তি করা হয়নি) বজায় থাকে।
তারপর আমরা ব্যবহার strategy.entry ফাংশন প্রবেশ এবং একটি যদি শর্ত বিচার সংকেত ট্রিগার ক্ষেত্রে একটি অবস্থান খুলতে, এবং সেট করুনstrategy.exitএকই সময়ে ক্ষতি বন্ধ এবং ট্রেইল মুনাফা ফাংশন।
সম্পূর্ণ কোড
/*backtest
start: 2022-01-01 00:00:00
end: 2022-10-08 00:00:00
period: 15m
basePeriod: 5m
exchanges: [{"eid":"Futures_Binance","currency":"ETH_USDT"}]
args: [["ZPrecision",0,358374]]
*/

// This source code is subject to the terms of the Mozilla Public License 2.0 at https://mozilla.org/MPL/2.0/

// Credits to the original Script - Range Filter DonovanWall https://www.tradingview.com/script/lut7sBgG-Range-Filter-DW/
// This version is the old version of the Range Filter with less settings to tinker with

//@version=4
study(title="Range Filter - B&S Signals", shorttitle="RF - B&S Signals", overlay=true)

//-----------------------------------------------------------------------------------------------------------------------------------------------------------------
//Functions
//-----------------------------------------------------------------------------------------------------------------------------------------------------------------

//Range Size Function
rng_size(x, qty, n)=>
//    AC       = Cond_EMA(abs(x - x[1]), 1, n)
    wper      = (n*2) - 1
    avrng     = ema(abs(x - x[1]), n)
    AC = ema(avrng, wper)*qty
    rng_size = AC

//Range Filter Function
rng_filt(x, rng_, n)=>
    r          = rng_
    var rfilt  = array.new_float(2, x)
    array.set(rfilt, 1, array.get(rfilt, 0))
    if x - r > array.get(rfilt, 1)
        array.set(rfilt, 0, x - r)
    if x + r < array.get(rfilt, 1)
        array.set(rfilt, 0, x + r)
    rng_filt1 = array.get(rfilt, 0)

    hi_band   = rng_filt1 + r
    lo_band   = rng_filt1 - r
    rng_filt  = rng_filt1
    [hi_band, lo_band, rng_filt]

//-----------------------------------------------------------------------------------------------------------------------------------------------------------------
//Inputs
//-----------------------------------------------------------------------------------------------------------------------------------------------------------------

//Range Source
rng_src = input(defval=close, type=input.source, title="Swing Source")

//Range Period
rng_per = input(defval=20, minval=1, title="Swing Period")

//Range Size Inputs
rng_qty   = input(defval=3.5, minval=0.0000001, title="Swing Multiplier")

//Bar Colors
use_barcolor = input(defval=false, type=input.bool, title="Bar Colors On/Off")

//-----------------------------------------------------------------------------------------------------------------------------------------------------------------
//Definitions
//-----------------------------------------------------------------------------------------------------------------------------------------------------------------

//Range Filter Values
[h_band, l_band, filt] = rng_filt(rng_src, rng_size(rng_src, rng_qty, rng_per), rng_per)

//Direction Conditions
var fdir = 0.0
fdir    := filt > filt[1] ? 1 : filt < filt[1] ? -1 : fdir
upward   = fdir==1 ? 1 : 0
downward = fdir==-1 ? 1 : 0

//Trading Condition
longCond = rng_src > filt and rng_src > rng_src[1] and upward > 0 or rng_src > filt and rng_src < rng_src[1] and upward > 0
shortCond = rng_src < filt and rng_src < rng_src[1] and downward > 0 or rng_src < filt and rng_src > rng_src[1] and downward > 0

CondIni = 0
CondIni := longCond ? 1 : shortCond ? -1 : CondIni[1]
longCondition = longCond and CondIni[1] == -1
shortCondition = shortCond and CondIni[1] == 1

//Colors
filt_color = upward ? #05ff9b : downward ? #ff0583 : #cccccc
bar_color  = upward and (rng_src > filt) ? (rng_src > rng_src[1] ? #05ff9b : #00b36b) :
             downward and (rng_src < filt) ? (rng_src < rng_src[1] ? #ff0583 : #b8005d) : #cccccc

//-----------------------------------------------------------------------------------------------------------------------------------------------------------------
//Outputs
//-----------------------------------------------------------------------------------------------------------------------------------------------------------------

//Filter Plot
filt_plot = plot(filt, color=filt_color, transp=67, linewidth=3, title="Filter")

//Band Plots
h_band_plot = plot(h_band, color=color.new(#05ff9b, 100), title="High Band")
l_band_plot = plot(l_band, color=color.new(#ff0583, 100), title="Low Band")

//Band Fills
fill(h_band_plot, filt_plot, color=color.new(#00b36b, 92), title="High Band Fill")
fill(l_band_plot, filt_plot, color=color.new(#b8005d, 92), title="Low Band Fill")

//Bar Color
barcolor(use_barcolor ? bar_color : na)

//Plot Buy and Sell Labels
plotshape(longCondition, title = "Buy Signal", text ="BUY", textcolor = color.white, style=shape.labelup, size = size.normal, location=location.belowbar, color = color.new(color.green, 0))
plotshape(shortCondition, title = "Sell Signal", text ="SELL", textcolor = color.white, style=shape.labeldown, size = size.normal, location=location.abovebar, color = color.new(color.red, 0))

//Alerts
alertcondition(longCondition, title="Buy Alert", message = "BUY")
alertcondition(shortCondition, title="Sell Alert", message = "SELL")


// extend
fastEmaPeriod = input(50, "fastEmaPeriod")
slowEmaPeriod = input(200, "slowEmaPeriod")
loss = input(30, "loss")
trailPoints = input(30, "trailPoints")
trailOffset = input(30, "trailOffset")
amount = input(1, "amount")

emaFast = ta.ema(close, fastEmaPeriod)
emaSlow = ta.ema(close, slowEmaPeriod)

buyCondition = longCondition and emaFast > emaSlow and close > open and close > emaFast
sellCondition = shortCondition and emaFast < emaSlow and close < open and close < emaFast

if buyCondition and strategy.position_size == 0
    strategy.entry("long", strategy.long, amount)
    strategy.exit("exit_long", "long", amount, loss=loss, trail_points=trailPoints, trail_offset=trailOffset)
if sellCondition and strategy.position_size == 0
    strategy.entry("short", strategy.short, amount)
    strategy.exit("exit_short", "short", amount, loss=loss, trail_points=trailPoints, trail_offset=trailOffset)
ব্যাকটেস্ট
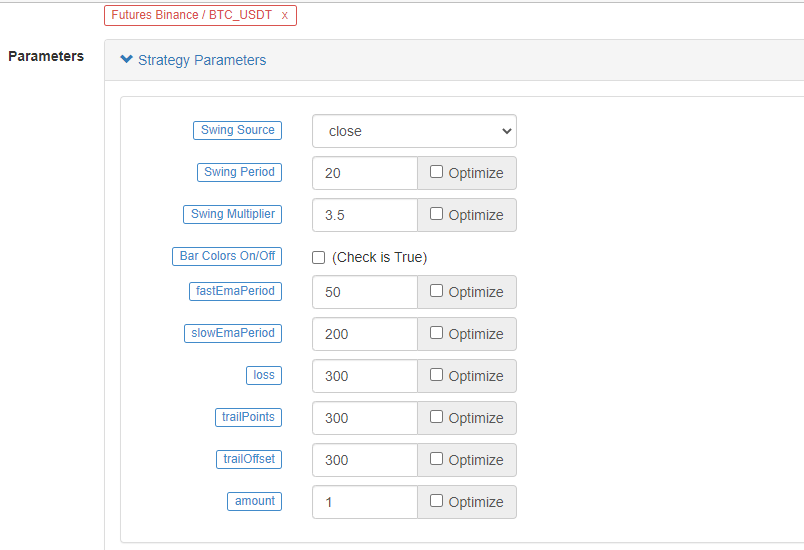
ব্যাকটেস্টের সময়সীমা জানুয়ারী ২০২২ থেকে অক্টোবর ২০২২। কে-লাইন সময়কাল ১৫ মিনিট এবং ব্যাকটেস্টের জন্য বন্ধের মূল্য মডেল ব্যবহার করা হয়। বাজার বাইনারেন্স ইটিএইচ_ইউএসডিটি চিরস্থায়ী চুক্তি বেছে নেয়। প্যারামিটারগুলি উত্স ভিডিওতে দ্রুত লাইনের ৫০ টি সময়কাল এবং ধীর লাইনের ২০০ টি সময়কাল অনুসারে সেট করা হয়। অন্যান্য প্যারামিটারগুলি ডিফল্টরূপে অপরিবর্তিত থাকে। আমি স্টপ লস এবং ট্র্যাকিং স্টপ লাভ পয়েন্টগুলিকে 30 পয়েন্টে স্বতঃস্ফূর্তভাবে সেট করেছি।
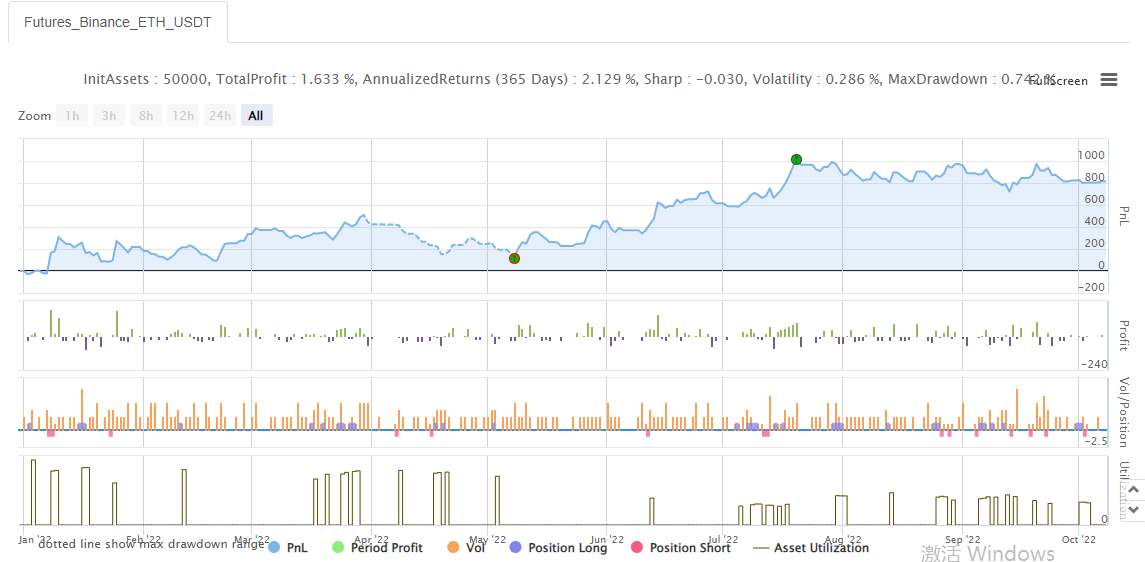
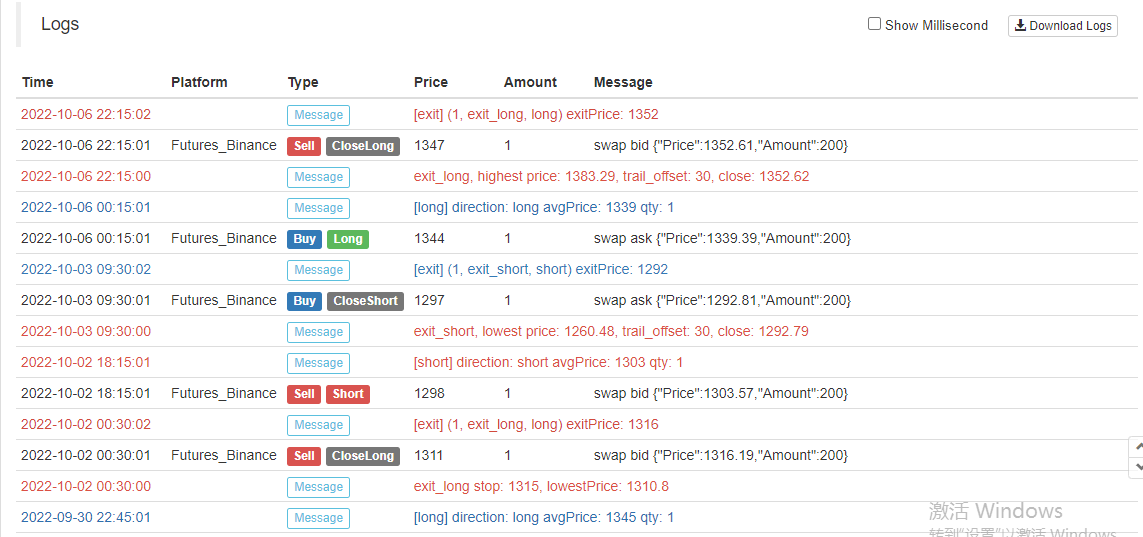
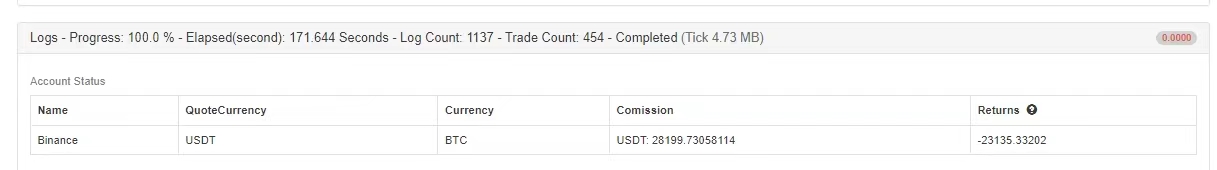
ব্যাকটেস্টিংয়ের ফলাফলগুলি সাধারণ, এবং মনে হয় স্টপ-লস পরামিতিগুলি ব্যাকটেস্টিংয়ের ফলাফলগুলিতে কিছুটা প্রভাব ফেলে। আমি অনুভব করি যে এই দিকটি এখনও অনুকূলিতকরণ এবং ডিজাইন করা দরকার। তবে কৌশলগত সংকেতটি ট্রেডিংয়ের সূচনা করার পরে, বিজয়ী হারটি এখনও ঠিক আছে।
আসুন একটি ভিন্ন বিটিসি_ইউএসডিটি চিরস্থায়ী চুক্তি চেষ্টা করিঃ
বিটিসির ব্যাকটেস্টের ফলাফলও খুব লাভজনক ছিল:
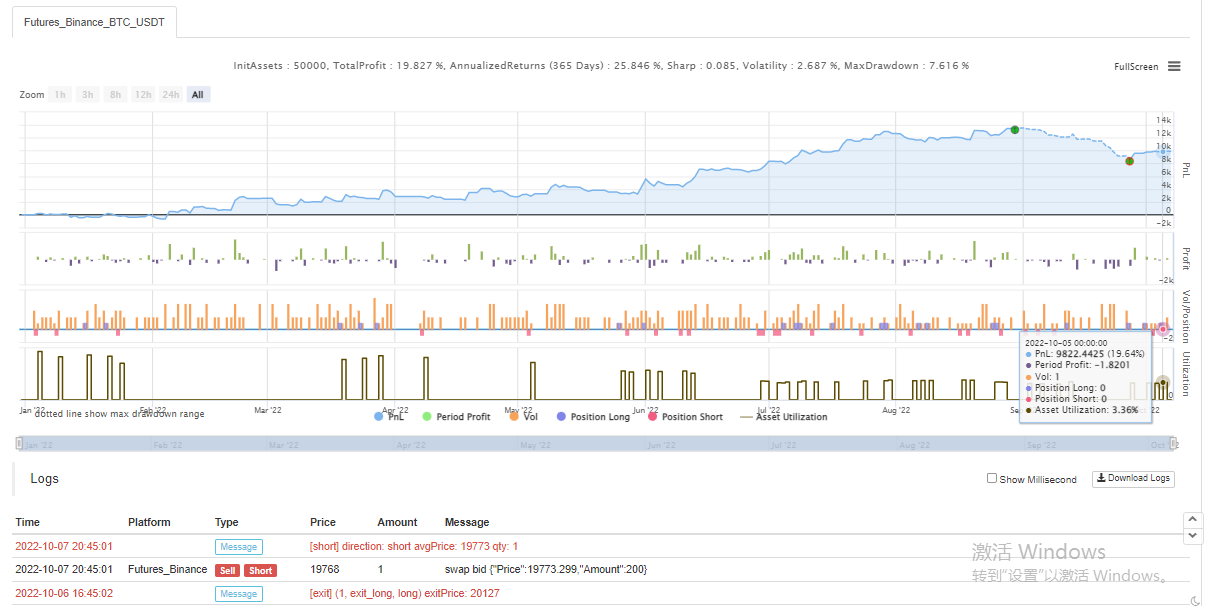
কৌশলঃhttps://www.fmz.com/strategy/385745
মনে হচ্ছে যে এই ট্রেডিং পদ্ধতিটি প্রবণতা বোঝার জন্য তুলনামূলকভাবে নির্ভরযোগ্য, আপনি এই ধারণা অনুযায়ী নকশাটি অপ্টিমাইজ করা চালিয়ে যেতে পারেন। এই নিবন্ধে, আমরা কেবল ডাবল চলমান গড় কৌশলটির ধারণা সম্পর্কেই শিখেছি না, তবে ইউটিউবে প্রবীণদের কৌশলটি কীভাবে প্রক্রিয়া করতে এবং শিখতে শিখেছি। ঠিক আছে, উপরের কৌশল কোডটি কেবল আমার ইট এবং মর্টার, ব্যাকটেস্টের ফলাফলগুলি নির্দিষ্ট রিয়েল-বট ফলাফলগুলি উপস্থাপন করে না, কৌশল কোড, নকশা কেবলমাত্র রেফারেন্সের জন্য। আপনার সমর্থনের জন্য আপনাকে ধন্যবাদ, আমরা আপনাকে পরের বার দেখব!
- ক্রিপ্টোকারেন্সি মার্কেটে মৌলিক বিশ্লেষণের পরিমাণ নির্ধারণঃ তথ্য নিজের জন্য কথা বলতে দিন!
- মুদ্রাচক্রের মৌলিক পরিমাণগত গবেষণা - এখন আর সব ধরনের ধাঁধাবাদী শিক্ষকদের বিশ্বাস করা বন্ধ করুন, তথ্য অবজেক্টিভভাবে কথা বলছে!
- কোয়ালিফাইড লেনদেনের জন্য একটি অপরিহার্য সরঞ্জাম - উদ্ভাবক কোয়ালিফাইড ডেটা এক্সপ্লোরার মডিউল
- সবকিছু আয়ত্ত করা - এফএমজেড ট্রেডিং টার্মিনালের নতুন সংস্করণে ভূমিকা (টিআরবি আর্বিট্রেজ সোর্স কোড সহ)
- এফএমজেডের নতুন ট্রেডিং টার্মিনালের সাথে পরিচিত হোন (ট্র্যাফিক কোড সহ)
- FMZ Quant: ক্রিপ্টোকারেন্সি মার্কেটে সাধারণ প্রয়োজনীয়তা ডিজাইন উদাহরণগুলির বিশ্লেষণ (II)
- কিভাবে 80 লাইন কোডে একটি উচ্চ ফ্রিকোয়েন্সি কৌশল সঙ্গে মস্তিষ্কহীন বিক্রয় বট শোষণ
- এফএমজেড পরিমাণঃ ক্রিপ্টোকারেন্সি বাজারের সাধারণ চাহিদা ডিজাইন উদাহরণ বিশ্লেষণ (২)
- ৮০ লাইন কোডের উচ্চ-প্রবাহের কৌশল ব্যবহার করে মস্তিষ্কবিহীন রোবটকে কীভাবে বিক্রি করা যায়
- FMZ Quant: ক্রিপ্টোকারেন্সি মার্কেটে সাধারণ প্রয়োজনীয়তা ডিজাইন উদাহরণগুলির বিশ্লেষণ (I)
- এফএমজেড কোয়াটিফিকেশনঃ ক্রিপ্টোকারেন্সি মার্কেটের সাধারণ চাহিদা ডিজাইন উদাহরণ বিশ্লেষণ