ডিজিটাল মুদ্রা ফিউচার মাল্টি-স্পিসিস ATR কৌশল (টিউটোরিয়াল)
লেখক:লিডিয়া, সৃষ্টিঃ ২০২২-১১-০৮ ১০ঃ৩৪ঃ২২, আপডেটঃ ২০২৩-০৯-১৫ ২০ঃ৫৫ঃ৩৩
সাম্প্রতিককালে, আমাদের প্ল্যাটফর্মের কিছু ব্যবহারকারী একটি মাইল্যাঙ্গুয়েজ কৌশলকে একটি জাভাস্ক্রিপ্ট কৌশলতে প্রতিস্থাপনের অপেক্ষায় রয়েছেন, যা নমনীয়ভাবে অনেকগুলি অপ্টিমাইজেশন ধারণা যুক্ত করতে পারে। এমনকি কৌশলটিকে বহু-প্রজাতির সংস্করণে প্রসারিত করতে পারে। কারণ মাইল্যাঙ্গুয়েজ কৌশলটি সাধারণত একটি ট্রেন্ড কৌশল এবং তাদের মধ্যে অনেকগুলি বন্ধের মূল্য মডেলের ভিত্তিতে কার্যকর করা হয়। কৌশল অনুরোধ বিনিময়ের এপিআই ইন্টারফেস খুব ঘন ঘন নয়, যা বহু-প্রজাতির কৌশল সংস্করণে প্রতিস্থাপনের জন্য উপযুক্ত। এই নিবন্ধে, আমরা জাভাস্ক্রিপ্ট ভাষার একটি সহজ সংস্করণে প্রতিস্থাপনের জন্য একটি সহজ মাইল্যাঙ্গুয়েজ কৌশলকে উদাহরণ হিসাবে নেব। প্রধান উদ্দেশ্যটি শিক্ষণ এবং সমর্থন গবেষণা। আপনি যদি একটি বাস্তব বট তৈরি করতে চান তবে আপনাকে কিছু বিবরণ যুক্ত করতে হতে পারে (অর্ডারের পরীক্ষা মূল্য, পরিমাণের শতাংশ নির্ভুলতা, অর্ডার পরিমাণ নিয়ন্ত্রণ, সম্পদ দ্বারা অর্ডার প্রদর্শন, স্থিতি তথ্য ইত্যাদি) এবং এছাড়াও বাস্তব বট পরীক্ষার প্রয়োজন হতে পারে।
মাই ল্যাঙ্গুয়েজের কৌশল রূপান্তরিত হবে
TR:=MAX(MAX((H-L),ABS(REF(C,1)-H)),ABS(REF(C,1)-L));
ATR:=EMA(TR,LENGTH2);

MIDLINE^^EMA((H + L + C)/3,LENGTH1);
UPBAND^^MIDLINE + N*ATR;
DOWNBAND^^MIDLINE - N*ATR;


BKVOL=0 AND C>=UPBAND AND REF(C,1)<REF(UPBAND,1),BPK;
SKVOL=0 AND C<=DOWNBAND AND REF(C,1)>REF(DOWNBAND,1),SPK;

BKVOL>0 AND C<=MIDLINE,SP(BKVOL);
SKVOL>0 AND C>=MIDLINE,BP(SKVOL);
// stop loss
// stop loss
C>=SKPRICE*(1+SLOSS*0.01),BP;
C<=BKPRICE*(1-SLOSS*0.01),SP;
AUTOFILTER;
এই কৌশলটির ট্রেডিং লজিকটি সহজ। প্রথমে, পরামিতি অনুসারে ATR গণনা করুন, তারপরে সমস্ত কে-লাইন BAR এর সর্বোচ্চ, সর্বনিম্ন এবং বন্ধের দামের গড় গণনা করুন এবং তারপরে গড় ডেটা অনুসারে EMA সূচক গণনা করুন। অবশেষে, আপব্যান্ড এবং ডাউনব্যান্ড গণনা করতে পরামিতিগুলিতে ATR এবং সহগ N একত্রিত করুন।
খোলার এবং বিক্রয় পজিশনগুলি বন্ধের মূল্যে ভিত্তি করে। যখন এটি আপব্যান্ড অতিক্রম করে তখন লং পজিশন খুলুন এবং খোলার অবস্থানটি বিক্রয় করুন (যখন শর্ট পজিশন রাখা হয়) । যখন এটি ডাউনব্যান্ড অতিক্রম করে তখন শর্ট পজিশন খুলুন এবং খোলার অবস্থানটি বিক্রয় করুন। যখন বন্ধের মূল্য মধ্যরেখায় পৌঁছে যায়, তখন পজিশনটি বন্ধ হয়ে যায় এবং যখন বন্ধের মূল্য স্টপ লস মূল্যে পৌঁছে যায়, তখন পজিশনটিও বন্ধ হয়ে যায় (এসএলওএসএস অনুসারে স্টপ লস 1, অর্থাৎ 0.01, অর্থাৎ 1%) । এই কৌশলটি বন্ধের মূল্যের মডেলের মাধ্যমে কার্যকর করা হয়।
ঠিক আছে, যদি আমরা মাইল্যাঙ্গুয়েজের কৌশলগত প্রয়োজনীয়তা এবং ধারণা বুঝতে পারি, তাহলে আমরা সেগুলি প্রতিস্থাপন করতে শুরু করতে পারি।
ট্রান্সপ্ল্যান্ট এবং ডিজাইন কৌশল প্রোটোটাইপ
কৌশল প্রোটোটাইপ কোডগুলি খুব বেশি নয়, 1 থেকে 200 লাইন পর্যন্ত। কৌশল লেখার ধারণাগুলি শেখার সুবিধার্থে, মন্তব্যগুলি সরাসরি কৌশল কোডে লেখা হয়।
// parse params parameters, and parse strings as objects
var arrParam = JSON.parse(params)

// this function creates a chart configuration
function createChartConfig(symbol, atrPeriod, emaPeriod, index) {   // symbol : trading pair, atrPeriod : ATR parameter period , emaPeriod : EMA parameter period, exchange object index corresponding to index
    var chart = {
        __isStock: true,
        extension: {
                layout: 'single',
                height: 600,
        },
        title : { text : symbol},
        xAxis: { type: 'datetime'},
        series : [
            {
                type: 'candlestick',    // K-line data series
                name: symbol,
                id: symbol + "-" + index,
                data: []
            }, {
                type: 'line',           // EMA
                name: symbol + ',EMA:' + emaPeriod,
                data: [],
            }, {
                type: 'line',           // upBand
                name: symbol + ',upBand' + atrPeriod,
                data: []
            }, {
                type: 'line',           // downBand
                name: symbol + ',downBand' + atrPeriod,
                data: []
            }, {
                type: 'flags',
                onSeries: symbol + "-" + index,
                data: [],
            }
        ]
    }
    return chart
}

// main Logic
function process(e, kIndex, c) {    // e is the exchange object, exchanges [0]..., kIndex is the K-line data series in the chart, and c is the chart object
    // obtain K-line data
    var r = e.GetRecords(e.param.period)
    if (!r || r.length < e.param.atrPeriod + 2 || r.length < e.param.emaPeriod + 2) {
        // if the K-line data length is insufficient, return
        return
    }

    // calculate ATR indicators
    var atr = TA.ATR(r, e.param.atrPeriod)
    var arrAvgPrice = []
    _.each(r, function(bar) {
        arrAvgPrice.push((bar.High + bar.Low + bar.Close) / 3)
    })
    // calculate EMA indicators
    var midLine = TA.EMA(arrAvgPrice, e.param.emaPeriod)
    // calculate upBand and downBand
    var upBand = []
    var downBand = []
    _.each(midLine, function(mid, index) {
        if (index < e.param.emaPeriod - 1 || index < e.param.atrPeriod - 1) {
            upBand.push(NaN)
            downBand.push(NaN)
            return
        }
        upBand.push(mid + e.param.trackRatio * atr[index])
        downBand.push(mid - e.param.trackRatio * atr[index])
    })

    // draw the chart
    for (var i = 0 ; i < r.length ; i++) {
        if (r[i].Time == e.state.lastBarTime) {
            // update
            c.add(kIndex, [r[i].Time, r[i].Open, r[i].High, r[i].Low, r[i].Close], -1)
            c.add(kIndex + 1, [r[i].Time, midLine[i]], -1)
            c.add(kIndex + 2, [r[i].Time, upBand[i]], -1)
            c.add(kIndex + 3, [r[i].Time, downBand[i]], -1)
        } else if (r[i].Time > e.state.lastBarTime) {
            // add
            e.state.lastBarTime = r[i].Time
            c.add(kIndex, [r[i].Time, r[i].Open, r[i].High, r[i].Low, r[i].Close])
            c.add(kIndex + 1, [r[i].Time, midLine[i]])
            c.add(kIndex + 2, [r[i].Time, upBand[i]])
            c.add(kIndex + 3, [r[i].Time, downBand[i]])
        }
    }

    // check the position
    var pos = e.GetPosition()
    if (!pos) {
        return
    }
    var holdAmount = 0
    var holdPrice = 0
    if (pos.length > 1) {
        throw "long and short positions are checked at the same time!"
    } else if (pos.length != 0) {
        holdAmount = pos[0].Type == PD_LONG ? pos[0].Amount : -pos[0].Amount
        holdPrice = pos[0].Price
    }

    if (e.state.preBar == -1) {
        e.state.preBar = r[r.length - 1].Time
    }
    // check the signal
    if (e.state.preBar != r[r.length - 1].Time) {   // closing price model
        if (holdAmount <= 0 && r[r.length - 3].Close < upBand[upBand.length - 3] && r[r.length - 2].Close > upBand[upBand.length - 2]) {   // the closing price cross over the upBand
            if (holdAmount < 0) {   // hold a short positions, close them
                Log(e.GetCurrency(), "close short positions", "#FF0000")
                $.CoverShort(e, e.param.symbol, Math.abs(holdAmount))
                c.add(kIndex + 4, {x: r[r.length - 2].Time, color: 'red', shape: 'flag', title: 'close', text: "close short positions"})
            }
            // open long positions
            Log(e.GetCurrency(), "open long positions", "#FF0000")
            $.OpenLong(e, e.param.symbol, 10)
            c.add(kIndex + 4, {x: r[r.length - 2].Time, color: 'red', shape: 'flag', title: 'long', text: "open long positions"})
        } else if (holdAmount >= 0 && r[r.length - 3].Close > downBand[downBand.length - 3] && r[r.length - 2].Close < downBand[downBand.length - 2]) {  // the closing price cross down the downBand
            if (holdAmount > 0) {   // hold long positions, close them
                Log(e.GetCurrency(), "close long positions", "#FF0000")
                $.CoverLong(e, e.param.symbol, Math.abs(holdAmount))
                c.add(kIndex + 4, {x: r[r.length - 2].Time, color: 'green', shape: 'flag', title: 'close', text: "close long positions"})
            }
            // open short positions
            Log(e.GetCurrency(), "open short positions", "#FF0000")
            $.OpenShort(e, e.param.symbol, 10)
            c.add(kIndex + 4, {x: r[r.length - 2].Time, color: 'green', shape: 'flag', title: 'short', text: "open short positions"})
        } else {
            // close positions
            if (holdAmount > 0 && (r[r.length - 2].Close <= holdPrice * (1 - e.param.stopLoss) || r[r.length - 2].Close <= midLine[midLine.length - 2])) {   // Hold a long position, the closing price is less than or equal to the midline, stop loss at the opening price
                Log(e.GetCurrency(), "trigger midline or stop loss, close long positions", "#FF0000")
                $.CoverLong(e, e.param.symbol, Math.abs(holdAmount))
                c.add(kIndex + 4, {x: r[r.length - 2].Time, color: 'green', shape: 'flag', title: 'close', text: "close long positions"})
            } else if (holdAmount < 0 && (r[r.length - 2].Close >= holdPrice * (1 + e.param.stopLoss) || r[r.length - 2].Close >= midLine[midLine.length - 2])) {  // Hold a short position, the closing price is greater than or equal to the midline, stop loss at the opening price
                Log(e.GetCurrency(), "trigger midline or stop loss, close short positions", "#FF0000")
                $.CoverShort(e, e.param.symbol, Math.abs(holdAmount))
                c.add(kIndex + 4, {x: r[r.length - 2].Time, color: 'red', shape: 'flag', title: 'close', text: "close short positions"})
            }
        }
        e.state.preBar = r[r.length - 1].Time
    }
}

function main() {
    var arrChartConfig = []
    if (arrParam.length != exchanges.length) {
        throw "Parameters and exchange objects do not match!"
    }
    var arrState = _G("arrState")
    _.each(exchanges, function(e, index) {
        if (e.GetName() != "Futures_Binance") {
            throw "The exchange is not supported!"
        }
        e.param = arrParam[index]
        e.state = {lastBarTime: 0, symbol: e.param.symbol, currency: e.GetCurrency()}
        if (arrState) {
            if (arrState[index].symbol == e.param.symbol && arrState[index].currency == e.GetCurrency()) {
                Log("restore:", e.state)
                e.state = arrState[index]
            } else {
                throw "The restored data does not match the current settings!"
            }
        }
        e.state.preBar = -1   // initial setting -1
        e.SetContractType(e.param.symbol)
        Log(e.GetName(), e.GetLabel(), "set contracts:", e.param.symbol)
        arrChartConfig.push(createChartConfig(e.GetCurrency(), e.param.atrPeriod, e.param.emaPeriod, index))
    })
    var chart = Chart(arrChartConfig)
    chart.reset()

    while (true) {
        _.each(exchanges, function(e, index) {
            process(e, index + index * 4, chart)
            Sleep(500)
        })
    }
}

function onexit() {
    // record e.state
    var arrState = []
    _.each(exchanges, function(e) {
        arrState.push(e.state)
    })
    Log("record:", arrState)
    _G("arrState", arrState)
}
কৌশলগত পরামিতি:
var params = '[{
        "symbol" : "swap",    // contract code
        "period" : 86400,     // K-line period, 86,400 seconds is a day
        "stopLoss" : 0.07,    // stop loss factor, 0.07 or 7%
        "atrPeriod" : 10,     // ATR indicator parameters
        "emaPeriod" : 10,     // EMA indicator parameters
        "trackRatio" : 1,     // upBand and downBand coefficients
        "openRatio" : 0.1     // The reserved opening percentage, which is not supported for now
    }, {
        "symbol" : "swap",
        "period" : 86400,
        "stopLoss" : 0.07,
        "atrPeriod" : 10,
        "emaPeriod" : 10,
        "trackRatio" : 1,
        "openRatio" : 0.1
    }]'
ব্যাকটেস্ট স্ক্রিনশটঃ
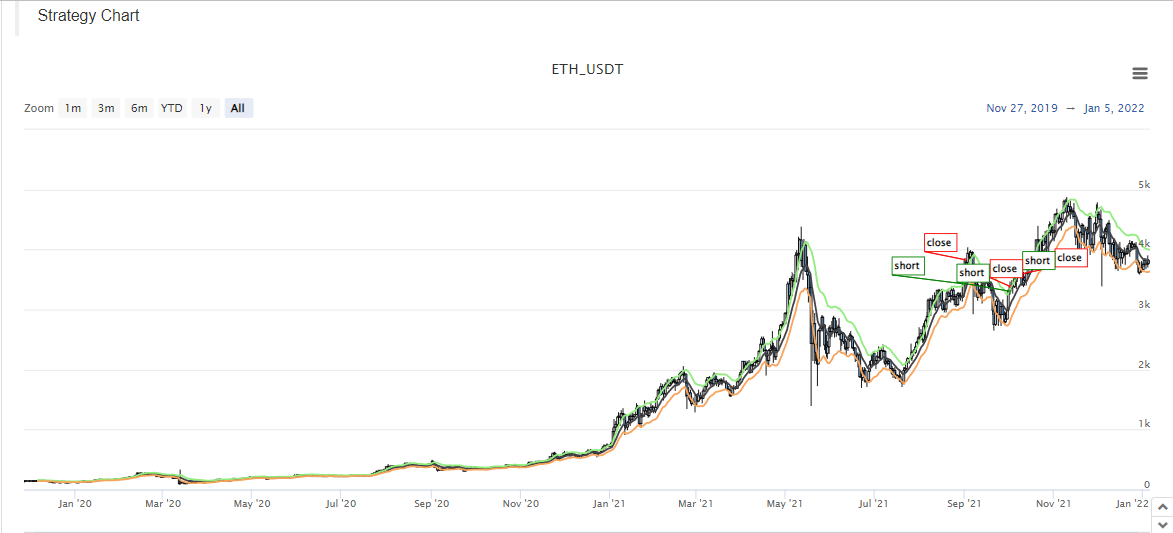
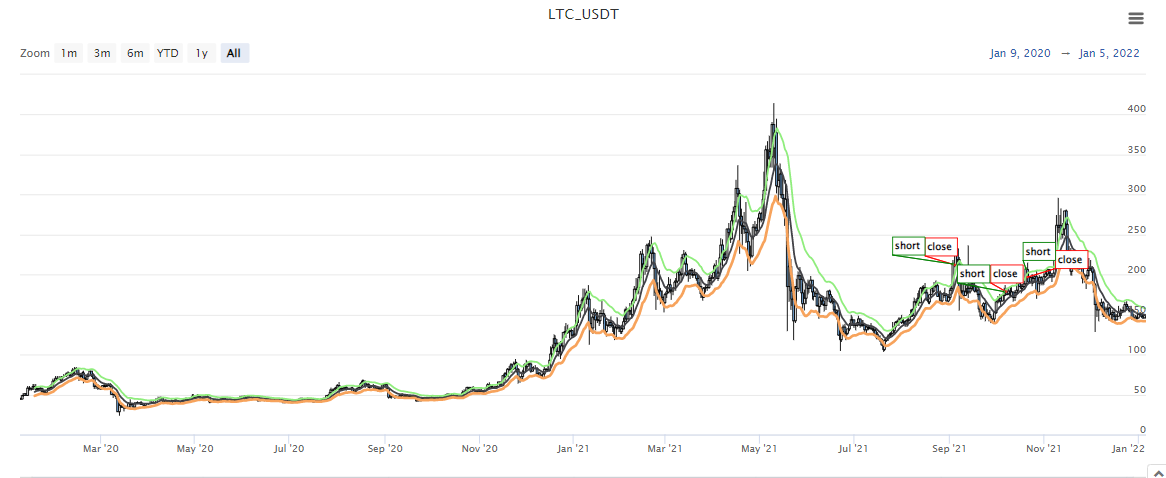
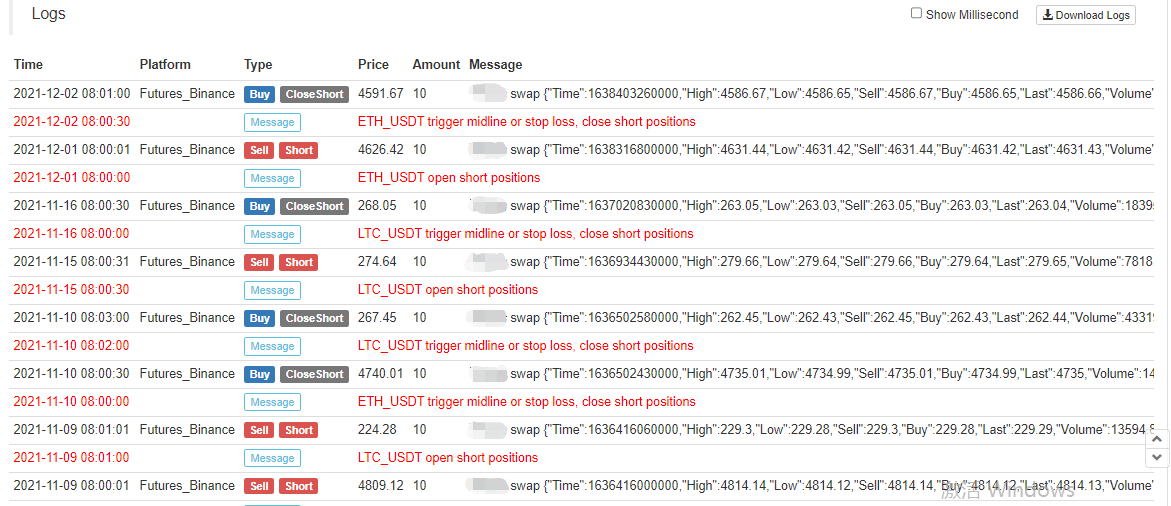
কৌশল উৎস কোডঃhttps://www.fmz.com/strategy/339344
কৌশলগুলি শুধুমাত্র ব্যাকটেস্টিং এবং শেখার গবেষণার জন্য। অনুগ্রহ করে পরিবর্তন করুন, অপ্টিমাইজ করুন, এবং নিজের দ্বারা আসল বটটি পড়ুন।
- ক্রিপ্টোকারেন্সি মার্কেটে মৌলিক বিশ্লেষণের পরিমাণ নির্ধারণঃ তথ্য নিজের জন্য কথা বলতে দিন!
- মুদ্রাচক্রের মৌলিক পরিমাণগত গবেষণা - এখন আর সব ধরনের ধাঁধাবাদী শিক্ষকদের বিশ্বাস করা বন্ধ করুন, তথ্য অবজেক্টিভভাবে কথা বলছে!
- কোয়ালিফাইড লেনদেনের জন্য একটি অপরিহার্য সরঞ্জাম - উদ্ভাবক কোয়ালিফাইড ডেটা এক্সপ্লোরার মডিউল
- সবকিছু আয়ত্ত করা - এফএমজেড ট্রেডিং টার্মিনালের নতুন সংস্করণে ভূমিকা (টিআরবি আর্বিট্রেজ সোর্স কোড সহ)
- এফএমজেডের নতুন ট্রেডিং টার্মিনালের সাথে পরিচিত হোন (ট্র্যাফিক কোড সহ)
- FMZ Quant: ক্রিপ্টোকারেন্সি মার্কেটে সাধারণ প্রয়োজনীয়তা ডিজাইন উদাহরণগুলির বিশ্লেষণ (II)
- কিভাবে 80 লাইন কোডে একটি উচ্চ ফ্রিকোয়েন্সি কৌশল সঙ্গে মস্তিষ্কহীন বিক্রয় বট শোষণ
- এফএমজেড পরিমাণঃ ক্রিপ্টোকারেন্সি বাজারের সাধারণ চাহিদা ডিজাইন উদাহরণ বিশ্লেষণ (২)
- ৮০ লাইন কোডের উচ্চ-প্রবাহের কৌশল ব্যবহার করে মস্তিষ্কবিহীন রোবটকে কীভাবে বিক্রি করা যায়
- FMZ Quant: ক্রিপ্টোকারেন্সি মার্কেটে সাধারণ প্রয়োজনীয়তা ডিজাইন উদাহরণগুলির বিশ্লেষণ (I)
- এফএমজেড কোয়াটিফিকেশনঃ ক্রিপ্টোকারেন্সি মার্কেটের সাধারণ চাহিদা ডিজাইন উদাহরণ বিশ্লেষণ