ভলিউম ডিভার্জেন্স
লেখক:চাওঝাং, তারিখ: ২০২২-০৫-২৬ ১৭ঃ০৪ঃ৩২ট্যাগঃডব্লিউএমএপিভট
এটি কেবলমাত্র একটি ভলিউম সূচক। আপনি ভলিউম আপট্রেন্ড এবং ভলিউম ডাউনট্রেন্ড উভয় ক্ষেত্রেই বিরতির জন্য নজর রাখতে হবে। এটি ভলিউমের মসৃণ চলমান গড় তৈরি করতে ফিবোনাচি সংখ্যা ব্যবহার করে।
এছাড়াও আপনি প্রবণতা বিপরীত এবং গতি হারানোর জন্য divergences চেক করতে পারেন।
ব্যাকটেস্ট
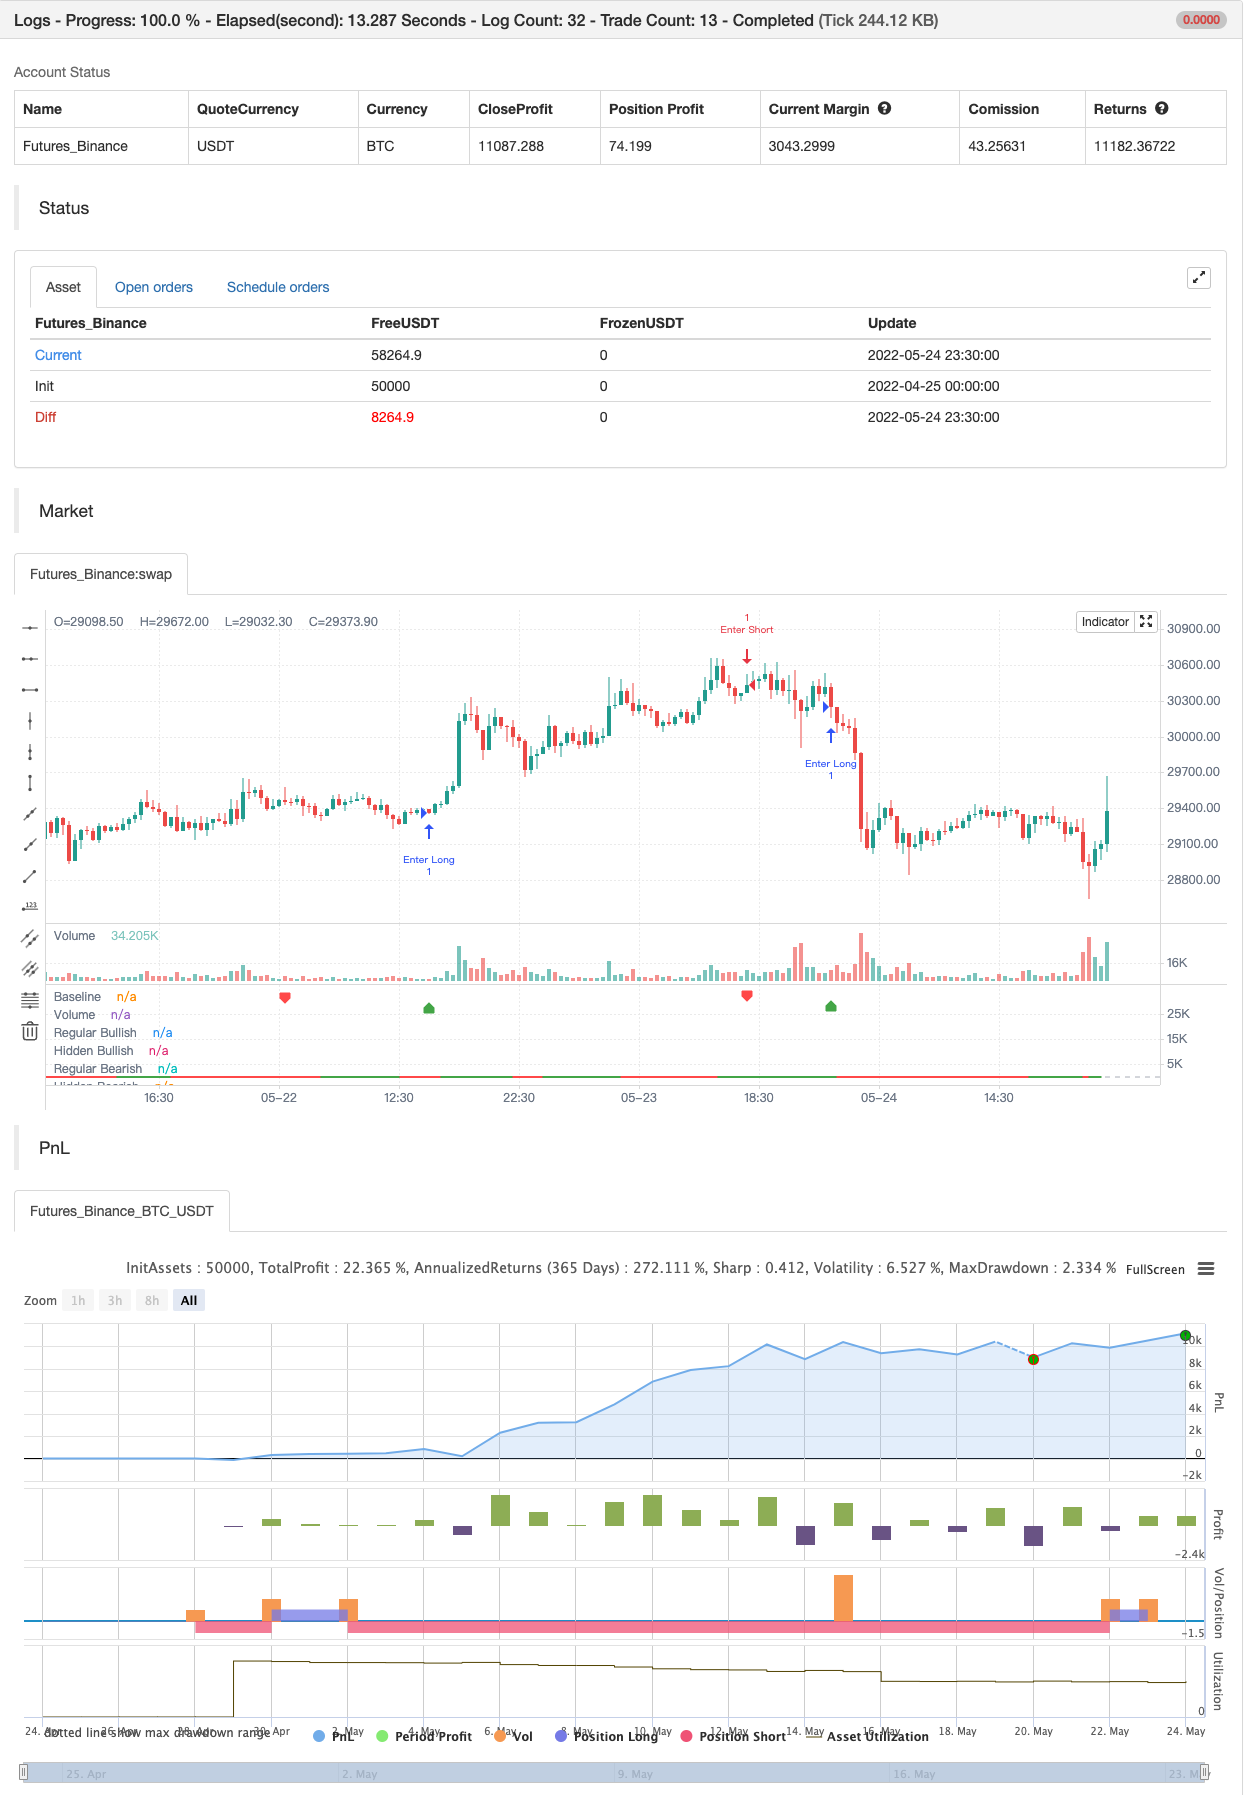
/*backtest
start: 2022-04-25 00:00:00
end: 2022-05-24 23:59:00
period: 30m
basePeriod: 15m
exchanges: [{"eid":"Futures_Binance","currency":"BTC_USDT"}]
*/

// This source code is subject to the terms of the Mozilla Public License 2.0 at https://mozilla.org/MPL/2.0/
// © baymucuk

//@version=4
study(title="Volume Divergence by MM", shorttitle="Volume Divergence", format=format.volume)

pine_wma(x, y) =>
    norm = 0.0
    sum = 0.0
    for i = 0 to y - 1
        weight = (y - i) * y
        norm := norm + weight
        factor = close[i] < open[i] ? -1 : 1
        sum := sum + (x[i] * weight * factor)
    sum / norm

vl1 = input(defval=5, title="First Moving Average length", type=input.integer)
vl2 = input(defval=8, title="Second Moving Average length", type=input.integer)
vl3 = vl1 + vl2
vl4 = vl2 + vl3
vl5 = vl3 + vl4

v1 = pine_wma(volume, vl1)
v2 = pine_wma(v1, vl2)
v3 = pine_wma(v2, vl3)
v4 = pine_wma(v3, vl4)
vol = pine_wma(v4, vl5)

vol_color = vol > 0 ? color.green : color.red
hline(0, title="Baseline", color=color.silver, linewidth=1)
plot(vol, color=vol_color, linewidth=2, title="Volume")

lbR = input(title="Pivot Lookback Right", defval=5)
lbL = input(title="Pivot Lookback Left", defval=5)
rangeUpper = input(title="Max of Lookback Range", defval=60)
rangeLower = input(title="Min of Lookback Range", defval=5)
plotBull = input(title="Plot Bullish", defval=true)
plotHiddenBull = input(title="Plot Hidden Bullish", defval=false)
plotBear = input(title="Plot Bearish", defval=true)
plotHiddenBear = input(title="Plot Hidden Bearish", defval=false)

bearColor = color.red
bullColor = color.green
hiddenBullColor = color.new(color.green, 25)
hiddenBearColor = color.new(color.red, 25)
textColor = color.white
noneColor = color.new(color.white, 100)

plFound = na(pivotlow(vol, lbL, lbR)) ? false : true
phFound = na(pivothigh(vol, lbL, lbR)) ? false : true

_inRange(cond) =>
    bars = barssince(cond == true)
    rangeLower <= bars and bars <= rangeUpper

//------------------------------------------------------------------------------
// Regular Bullish

// vol: Higher Low
volHL = vol[lbR] > valuewhen(plFound, vol[lbR], 1) and _inRange(plFound[1])

// Price: Lower Low
priceLL = low[lbR] < valuewhen(plFound, low[lbR], 1)

bullCond = plotBull and priceLL and volHL and plFound

plot(
	 plFound ? vol[lbR] : na,
	 offset=-lbR,
	 title="Regular Bullish",
	 linewidth=2,
	 color=(bullCond ? bullColor : noneColor),
	 transp=0
	 )

plotshape(
	 bullCond ? vol[lbR] : na,
	 offset=-lbR,
	 title="Regular Bullish Label",
	 text=" Bull ",
	 style=shape.labelup,
	 location=location.absolute,
	 color=bullColor,
	 textcolor=textColor,
	 transp=0
	 )

//------------------------------------------------------------------------------
// Hidden Bullish

// vol: Lower Low
volLL = vol[lbR] < valuewhen(plFound, vol[lbR], 1) and _inRange(plFound[1])

// Price: Higher Low
priceHL = low[lbR] > valuewhen(plFound, low[lbR], 1)

hiddenBullCond = plotHiddenBull and priceHL and volLL and plFound

plot(
	 plFound ? vol[lbR] : na,
	 offset=-lbR,
	 title="Hidden Bullish",
	 linewidth=2,
	 color=(hiddenBullCond ? hiddenBullColor : noneColor),
	 transp=0
	 )

plotshape(
	 hiddenBullCond ? vol[lbR] : na,
	 offset=-lbR,
	 title="Hidden Bullish Label",
	 text=" H Bull ",
	 style=shape.labelup,
	 location=location.absolute,
	 color=bullColor,
	 textcolor=textColor,
	 transp=0
	 )

//------------------------------------------------------------------------------
// Regular Bearish

// vol: Lower High
volLH = vol[lbR] < valuewhen(phFound, vol[lbR], 1) and _inRange(phFound[1])

// Price: Higher High
priceHH = high[lbR] > valuewhen(phFound, high[lbR], 1)

bearCond = plotBear and priceHH and volLH and phFound

plot(
	 phFound ? vol[lbR] : na,
	 offset=-lbR,
	 title="Regular Bearish",
	 linewidth=2,
	 color=(bearCond ? bearColor : noneColor),
	 transp=0
	 )

plotshape(
	 bearCond ? vol[lbR] : na,
	 offset=-lbR,
	 title="Regular Bearish Label",
	 text=" Bear ",
	 style=shape.labeldown,
	 location=location.absolute,
	 color=bearColor,
	 textcolor=textColor,
	 transp=0
	 )

//------------------------------------------------------------------------------
// Hidden Bearish

// vol: Higher High
volHH = vol[lbR] > valuewhen(phFound, vol[lbR], 1) and _inRange(phFound[1])

// Price: Lower High
priceLH = high[lbR] < valuewhen(phFound, high[lbR], 1)

hiddenBearCond = plotHiddenBear and priceLH and volHH and phFound

plot(
	 phFound ? vol[lbR] : na,
	 offset=-lbR,
	 title="Hidden Bearish",
	 linewidth=2,
	 color=(hiddenBearCond ? hiddenBearColor : noneColor),
	 transp=0
	 )

plotshape(
	 hiddenBearCond ? vol[lbR] : na,
	 offset=-lbR,
	 title="Hidden Bearish Label",
	 text=" H Bear ",
	 style=shape.labeldown,
	 location=location.absolute,
	 color=bearColor,
	 textcolor=textColor,
	 transp=0
	 )


if bullCond
    strategy.entry("Enter Long", strategy.long)
else if bearCond
    strategy.entry("Enter Short", strategy.short)
সম্পর্কিত
- jma + dwma multigrain দ্বারা
- সহজ স্টক
- ব্রাহ্মস্ত্রা
- পিভট ভিত্তিক ট্রেইলিং সর্বোচ্চ ও সর্বনিম্ন
- পিভট পয়েন্ট উচ্চ নিম্ন মাল্টি টাইম ফ্রেম
- পাইনস্ক্রিপ্ট কৌশলগুলিতে মাসিক রিটার্ন
- পিভট অর্ডার ব্লক
- উইলিয়ামস %R - মসৃণ
- হুল মুভিং এভারেজ সুইং ট্রেডার
- নিম্ন স্ক্যানার কৌশল ক্রিপ্টো
আরো
- সুপারট্রেক্স
- পিক ডিটেক্টর
- নিম্ন সন্ধানকারী
- এসএমএ ট্রেন্ড
- বোলিংজার সর্বনিম্ন
- সুপার ট্রেন্ড বি
- সুইং ট্রেড সিগন্যাল
- শ্যাফ ট্রেন্ড চক্র
- ৭২: অ্যাডাপ্টিভ হুল মুভিং মিভিং+
- ক্রয়/বিক্রয় সহ EMA ADX RSI এর স্কাল্পিং
- সুপার ট্রেন্ড ডেইলি ২.০ বিএফ
- হুল মুভিং এভারেজ সুইং ট্রেডার
- এফটিএসএমএ - ট্রেন্ড আপনার বন্ধু
- ব্যাপ্তি ফিল্টার কিনুন এবং বিক্রি করুন
- এসএসএল চ্যানেল
- হেল স্যুট কৌশল
- প্যারাবোলিক এসএআর কিনুন এবং বিক্রয় করুন
- পিভট ভিত্তিক ট্রেইলিং সর্বোচ্চ ও সর্বনিম্ন
- নিক রাইপক ট্রেলিং রিভার্স (এনআরটিআর)
- জিগজ্যাগ পিএ কৌশল V4.1