MACD ক্রসওভার কৌশল

ওভারভিউ
এই কৌশলটি দুটি ভিন্ন সময়ের সূচকীয় চলমান গড় (ইএমএ) ব্যবহার করে ক্রস করা হয়, যখন দ্রুত ইএমএ নীচে থেকে নীচে ধীর ইএমএ অতিক্রম করে তখন একটি কেনার সংকেত উত্পন্ন হয় এবং যখন দ্রুত ইএমএ নীচে থেকে নীচে ধীর ইএমএ অতিক্রম করে তখন একটি বিক্রয় সংকেত উত্পন্ন হয়। এই কৌশলটি বিভিন্ন আর্থিক যন্ত্র এবং সময়কালের জন্য প্রয়োগ করা যেতে পারে, যেমন স্বর্ণ 2 ঘন্টা সময়কালে সবচেয়ে কার্যকর, বিটকয়েন সূর্যের লাইন চার্টে সবচেয়ে কার্যকর ইত্যাদি।
কৌশল নীতি
- দ্রুত EMA (ডিফল্ট চক্র 12) এবং ধীর EMA (ডিফল্ট চক্র 26) গণনা করুন।
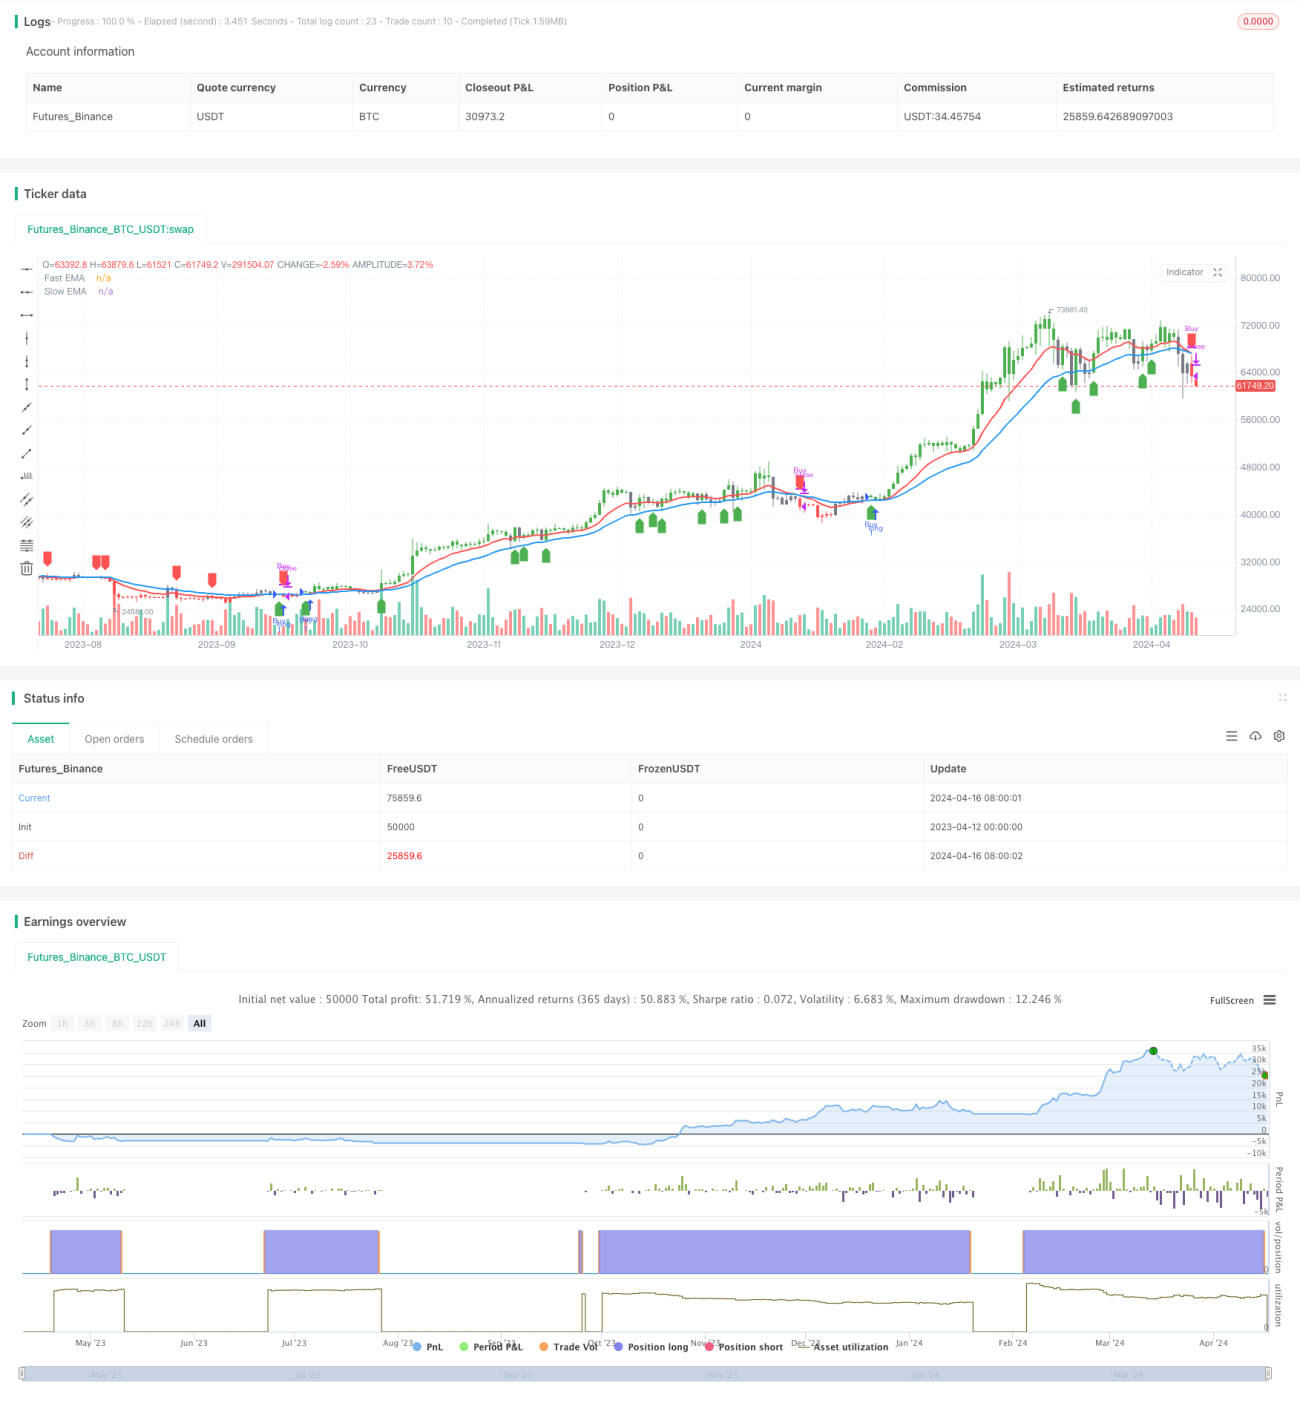
- সংজ্ঞায়িত করুন মাল্টি-হেড অঞ্চল ((দ্রুত ইএমএ ধীর ইএমএর উপরে এবং দাম দ্রুত ইএমএর উপরে) এবং ফাঁকা অঞ্চল ((দ্রুত ইএমএ ধীর ইএমএর নীচে এবং দাম দ্রুত ইএমএর নীচে)) ।
- খালি মাথা অঞ্চল থেকে মাল্টিহেড অঞ্চলে রূপান্তরিত হলে কেনা, যখন মাল্টিহেড অঞ্চল থেকে খালি মাথা অঞ্চলে রূপান্তরিত হলে বিক্রি করা।
- চার্টে সবুজ ও লাল রঙে মাল্টি হেড এবং খালি হেড এলাকা চিহ্নিত করুন, এবং একটি তীর দিয়ে ক্রয়-বিক্রয় সংকেত চিহ্নিত করুন।
কৌশলগত সুবিধা
- সহজ এবং সহজেই বোঝা যায়, নতুনদের জন্য উপযুক্ত।
- বিভিন্ন আর্থিক যন্ত্র এবং সময়কালের জন্য ব্যাপকভাবে প্রযোজ্য।
- ট্রেন্ড ট্র্যাকিংয়ের ক্ষমতা শক্তিশালী, যা মধ্য ও দীর্ঘমেয়াদী ট্রেন্ডকে ধরতে সক্ষম।
- প্যারামিটারগুলি সামঞ্জস্যযোগ্য, নমনীয়তা বাড়ায় <unk>
কৌশলগত ঝুঁকি
- "অস্থির বাজারগুলোতে ভুল সংকেত পাওয়া যায়, যার ফলে লোকসান হয়।
- প্রবণতা পরিবর্তনের সময় প্রতিক্রিয়া ধীর হয়, যার ফলে কিছু পয়েন্ট স্লাইড হয়।
- ভুল প্যারামিটার নির্বাচন করলে কৌশল প্রভাবিত হয়।
কৌশল অপ্টিমাইজেশনের দিকনির্দেশনা
- প্রবণতা ফিল্টার যোগ করুন, যেমন ADX একটি নির্দিষ্ট মানের চেয়ে বড় হলে ট্রেড করুন, অস্থির বাজারের ক্ষতি হ্রাস করুন।
- খেলার সময় অপ্টিমাইজ করা, যেমন এটিআর ব্যবহার করে স্টপ লস সিদ্ধান্ত নেওয়া, একক ক্ষতি হ্রাস করা।
- প্যারামিটারগুলিকে অপ্টিমাইজ করা, সর্বোত্তম প্যারামিটার সমন্বয় খুঁজে বের করা, স্থিতিশীলতা এবং লাভজনকতা বৃদ্ধি করা।
- অন্যান্য সূচক যেমন MACD, RSI ইত্যাদির সাথে সংযুক্ত করে, সংকেতের নির্ভুলতা বাড়ায়।
সারসংক্ষেপ
এমএসিডি ক্রস কৌশলটি একটি সহজ কৌশল যা প্রবণতা অনুসরণের উপর ভিত্তি করে, এর সুবিধাটি সহজ ব্যবহারিক, প্রয়োগের বিস্তৃত, ত্রুটিটি হ'ল প্রবণতা ঘুরিয়ে নেওয়া কঠিন, প্যারামিটার নির্বাচন করা কঠিন। প্রবণতা ফিল্টারিং, প্রবেশদ্বার, প্যারামিটার নির্বাচন এবং অন্যান্য সূচকগুলির সংমিশ্রণের মাধ্যমে এই কৌশলটির কার্যকারিতা উন্নত করা যেতে পারে, এটি আরও গবেষণা এবং পরীক্ষার জন্য উপযুক্ত।
/*backtest
start: 2023-04-12 00:00:00
end: 2024-04-17 00:00:00
period: 1d
basePeriod: 1h
exchanges: [{"eid":"Futures_Binance","currency":"BTC_USDT"}]
*/

//@version=5
strategy('Advance EMA Crossover Strategy', overlay=true, precision=6)
//****************************************************************************//
// CDC Action Zone is based on a simple EMA crossover - 1