ডুয়াল চেইন হাইব্রিড মোমেন্টাম মুভিং এভারেজ ট্র্যাকিং ট্রেডিং সিস্টেম

ওভারভিউ
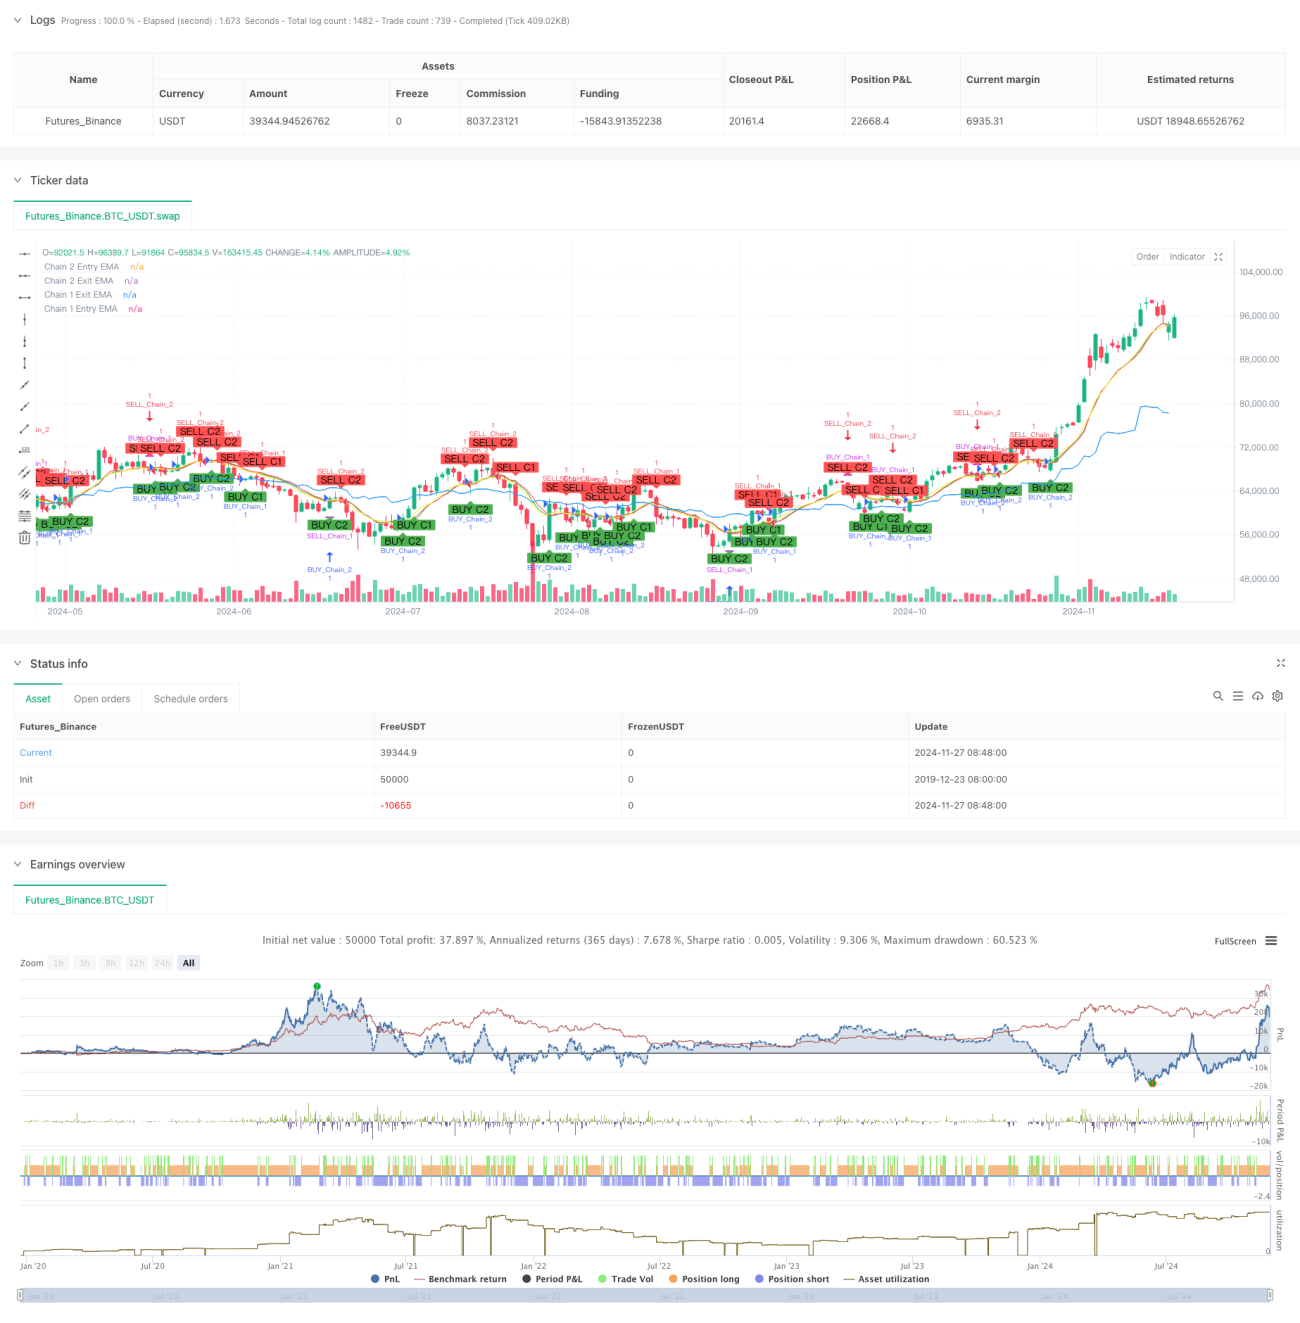
এই কৌশলটি একটি সূচকীয় মুভিং এভারেজ (ইএমএ) ভিত্তিক একটি উদ্ভাবনী ট্রেডিং সিস্টেম যা বিভিন্ন সময়কালের মধ্যে দুটি পৃথক ট্রেডিং চেইন স্থাপন করে বাজারের সুযোগকে ক্যাপচার করে। এই কৌশলটি দীর্ঘমেয়াদী প্রবণতা ট্র্যাকিং এবং স্বল্পমেয়াদী গতিশীলতার ট্রেডিংয়ের সুবিধাগুলিকে সংহত করে, বিভিন্ন সময়কালের ইএমএ ক্রস করে ট্রেডিং সংকেত তৈরি করে যেমন সাপ্তাহিক, দৈনিক, 12 ঘন্টা এবং 9 ঘন্টা ইত্যাদি।
কৌশল নীতি
কৌশলটি একটি দ্বৈত চেইন নকশা ব্যবহার করে, যার প্রতিটি চেইনের নিজস্ব প্রবেশ এবং প্রস্থান লজিক রয়েছেঃ
শৃঙ্খলা 1 ((দীর্ঘমেয়াদী প্রবণতা) দৈর্ঘ্য এবং দৈর্ঘ্য চক্র ব্যবহার করেঃ
- ইনপুট সিগন্যালঃ যখন ক্লোজিং প্রাইস ইএমএ অতিক্রম করে ঘূর্ণিঝড়ের চক্রের উপর থাকে তখন একটি মাল্টিসিগন্যাল তৈরি হয়
- প্রস্থান সংকেতঃ যখন বন্ধের দাম সূর্যের সময়কালের নীচে ইএমএ অতিক্রম করে তখন একটি প্লেইন সংকেত তৈরি হয়
- ডিফল্ট ইএমএ চক্রটি 10 হয়, যা প্রয়োজন অনুসারে সামঞ্জস্য করা যায়
শৃঙ্খলা 2 (স্বল্পমেয়াদী গতিশীলতা) 12 ঘন্টা এবং 9 ঘন্টা চক্র ব্যবহার করেঃ
- প্রবেশের সংকেত: যখন 12 ঘন্টার চক্রের উপর EMA অতিক্রম করে তখন একটি মাল্টি-সিগন্যাল তৈরি হয়
- প্রস্থান সংকেত: যখন বন্ধের দাম 9 ঘন্টা চক্রের মধ্যে EMA অতিক্রম করে তখন একটি প্লেইন সংকেত তৈরি হয়
- ডিফল্ট ইএমএ চক্রটি 9 এবং প্রয়োজন অনুসারে সামঞ্জস্য করা যায়
কৌশলগত সুবিধা
- মাল্টি-ডাইমেনশনাল মার্কেট অ্যানালিসিসঃ বিভিন্ন সময়কালের সমন্বয়ে বাজারের গতিবিধি সম্পর্কে সম্পূর্ণ ধারণা পাওয়া যায়
- নমনীয়তাঃ বিভিন্ন ট্রেডিং স্টাইলের জন্য দুটি চেইনকে আলাদাভাবে চালু বা বন্ধ করা যায়
- ঝুঁকি নিয়ন্ত্রণের উন্নতিঃ একাধিক সময়কালের মাধ্যমে নিশ্চিতকরণ, মিথ্যা সংকেতের ঝুঁকি হ্রাস করে
- প্যারামিটারগুলি সামঞ্জস্যপূর্ণঃ ইএমএ চক্র এবং সময় চক্র উভয়ই প্রয়োজন অনুসারে পরিবর্তন করা যায়
- পুনরুদ্ধার উন্নতঃ অন্তর্নির্মিত পুনরুদ্ধারের সময় সেটিং, যাচাইকরণ এবং কৌশল অপ্টিমাইজ করার জন্য
কৌশলগত ঝুঁকি
- প্রবণতা বিপরীত ঝুঁকিঃ তীব্র বাজারের মধ্যে পিছিয়ে যাওয়ার সম্ভাবনা
- টাইম সাইকেল কনফিগারেশন ঝুঁকিঃ বিভিন্ন বাজারে বিভিন্ন টাইম সাইকেল প্যাকেজ প্রয়োজন হতে পারে
- প্যারামিটার অপ্টিমাইজেশনের ঝুঁকিঃ অতিরিক্ত অপ্টিমাইজেশনের ফলে ওভারফিট হতে পারে
- সিগন্যাল ওভারল্যাপের ঝুঁকিঃ একই সময়ে দুটি চেইন ট্রিগার করলে পজিশন হোল্ডিংয়ের ঝুঁকি বাড়তে পারে
ঝুঁকি নিয়ন্ত্রণের পরামর্শ:
- যুক্তিসঙ্গত স্টপ লস সেট করুন
- বাজারের বৈশিষ্ট্য অনুসারে প্যারামিটারগুলি সামঞ্জস্য করুন
- শারীরিক পরীক্ষার আগে পর্যাপ্ত ফিডব্যাক
- প্রতিটি লেনদেনের মূলধন অনুপাত নিয়ন্ত্রণ করুন
কৌশল অপ্টিমাইজেশনের দিকনির্দেশনা
- সিগন্যাল ফিল্টারিং অপ্টিমাইজেশান:
- লেনদেন ভলিউম নিশ্চিতকরণ প্রক্রিয়া যোগ করুন
- চলমানতা সূচক ফিল্টারিং সংকেত প্রবর্তন
- প্রবণতা বৃদ্ধি নিশ্চিতকরণ
- ঝুঁকি নিয়ন্ত্রণ অপ্টিমাইজেশান:
- ডায়নামিক স্টপ লস মেকানিজম
- পজিশন ম্যানেজমেন্ট সিস্টেম ডিজাইন
- পুনরুদ্ধার নিয়ন্ত্রণ যোগ করা হয়েছে
- টাইম সাইকেল অপ্টিমাইজেশানঃ
- সর্বোত্তম সময়কাল সমন্বয় গবেষণা
- একটি স্বনির্ধারিত টাইম সাইকেল তৈরি করা
- বাজার অবস্থা সনাক্তকরণ যুক্ত করা হয়েছে
সারসংক্ষেপ
দ্বৈত চেইন মিশ্রিত পরিমাণের গড় লাইন ট্র্যাকিং ট্রেডিং সিস্টেমটি দীর্ঘ এবং স্বল্পমেয়াদী গড় লাইন কৌশলকে উদ্ভাবনীভাবে একত্রিত করে বাজারের বহু-মাত্রিক বিশ্লেষণ এবং উপলব্ধি অর্জন করে। সিস্টেমটি নমনীয়ভাবে ডিজাইন করা হয়েছে, বিভিন্ন বাজার পরিস্থিতি এবং ব্যবসায়ীর শৈলীর সাথে সামঞ্জস্য করা যেতে পারে, এটির শক্তিশালী ব্যবহার রয়েছে। যুক্তিসঙ্গত ঝুঁকি নিয়ন্ত্রণ এবং ক্রমাগত অপ্টিমাইজেশনের মাধ্যমে, কৌশলটি প্রকৃত ব্যবসায়ের ক্ষেত্রে স্থিতিশীল আয় পাওয়ার সম্ভাবনা রয়েছে। ব্যবসায়ীদের পরামর্শ দেওয়া হয় যে তারা তাদের প্যাকেজ ব্যবহারের আগে পর্যাপ্ত পরিমাণে ব্যাক-টেস্ট এবং প্যারামিটার অপ্টিমাইজেশন করে যাতে সর্বোত্তম ব্যবসায়ের প্রভাব অর্জন করতে পারে।
- 1