Implementierung der Fisher-Indikatoren und der FMZ in JavaScript-Sprache
Schriftsteller:Lydia., Erstellt: 2022-11-07 11:37:48, Aktualisiert: 2023-09-15 21:05:55
Während der technischen Analyse des Handels analysieren und studieren Händler die Aktienpreisdaten als die Daten der Normalverteilung.Fisher Transformationist eine Methode, die Preisdaten in normale Verteilung umwandeln kann.Fisher TransformationDie Handelssignale können mit Hilfe der Indikatoren des laufenden Tages und des vorhergehenden Tages gesendet werden.
Es gibt viele Inhalte über dieFisher TransformAuf Baidu, Zhihu, hier werden wir nicht wiederholen.
Indikator-Algorithmus:
-
Mittlerer Preis heute:
mid=(low + high) / 2 -
Berechnen Sie den Berechnungszeitraum, der 10 Tage betragen kann. Berechnen Sie den höchsten und niedrigsten Preis in der Periode:
lowestLow = lowest price in the period,highestHigh = highest price in the period. -
Definition des Preisänderungsparameters (der
ratioist eine Konstante zwischen 0 und 1, z. B. 0,5 oder 0,33):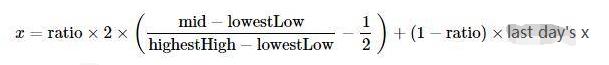
-
Mit Hilfe der
FisherUmwandlung des Preisänderungsparametersx, dieFisherDer Indikator wird ermittelt: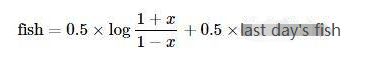
Implementieren Sie den Algorithmus mit der JavaScript-Sprache
Es wird Schritt für Schritt nach dem Indikator-Algorithmus implementiert.preXundpreFish, wurden sie zu Beginn auf 0 gesetzt.Math LogAußerdem hat der obige Algorithmus nicht die Korrektur von x erwähnt, die ich beim Schreiben fast ignoriert habe:
Korrigieren Sie den Wert von x, zwingen Sie es, 0,999 zu sein, wenn es größer als 0,99 ist.
        if (x > 0.99) {
            x = 0.999
        } else if (x < -0.99) {
            x = -0.999
        }
Das erste Mal, als ich den Algorithmus und die Indikatoren sah, habe ich sie nach dem Algorithmus transplantiert. Ich habe diese Implementierung nicht überprüft, und einige, die an der Forschung interessiert sind, können überprüfen, ob es Fehler gibt. Vielen Dank für die Fehler.
Fisher TransformQuellcode des Indikatoralgorithmus:
function getHighest(arr, period) {
    if (arr.length == 0 || arr.length - period < 0) {
        return null
    }
    var beginIndex = arr.length - period
    var ret = arr[beginIndex].High
    for (var i = 0 ; i < arr.length - 1 ; i++) {
        if (arr[i + 1].High > ret) {
            ret = arr[i + 1].High
        }
    }
    return ret
}

function getLowest(arr, period) {
    if (arr.length == 0 || arr.length - period < 0) {
        return null
    }
    var beginIndex = arr.length - period
    var ret = arr[beginIndex].Low
    for (var i = 0 ; i < arr.length - 1 ; i++) {
        if (arr[i + 1].Low < ret) {
            ret = arr[i + 1].Low
        }
    }
    return ret
}

function calcFisher(records, ratio, period) {
    var preFish = 0
    var preX = 0
    var arrFish = []
    // When the length of K-line is not enough to meet the period
    if (records.length < period) {
        for (var i = 0 ; i < records.length ; i++) {
            arrFish.push(0)
        }
        return arrFish
    }

    // traverse the K-line
    for (var i = 0 ; i < records.length ; i++) {
        var fish = 0
        var x = 0
        var bar = records[i]
        var mid = (bar.High + bar.Low) / 2
        // When the current BAR is insufficient in period calculation
        if (i < period - 1) {
            fish = 0
            preFish = 0
            arrFish.push(fish)
            continue
        }

        // Calculate the highest and lowest price in the period
        var bars = []
        for (var j = 0 ; j <= i ; j++) {
            bars.push(records[j])
        }
        var lowestLow = getLowest(bars, period)
        var highestHigh = getHighest(bars, period)

        // price change parameters
        x = ratio * 2 * ((mid - lowestLow) / (highestHigh - lowestLow) - 0.5) + (1 - ratio) * preX
        if (x > 0.99) {
            x = 0.999
        } else if (x < -0.99) {
            x = -0.999
        }
        preX = x
        fish = 0.5 * Math.log((1 + x) / (1 - x)) + 0.5 * preFish
        preFish = fish
        arrFish.push(fish)
    }
    return arrFish
}
Zeichnungsdiagramm
Es ist leicht, auf FMZ, Strategie Square zu zeichnen:https://www.fmz.com/squareEs gibt eine Vielzahl von Beispielen für Referenz, Sie können sie durchsuchen.
var cfg = {    // The object used to initialize chart settings (i.e. chart settings)
    plotOptions: {
        candlestick: {
            color: '#d75442',  // color value
            upColor: '#6ba583' // color value
        }
    },
    title: { text: 'Fisher Transform'},     //title
    subtitle: {text: ''},     //sub-title
    plotOptions: {
        candlestick: {
        tooltip: {
            pointFormat:
            '<span style="color:{point.color}">\u25CF</span> <b> {series.name}</b><br/>' +
            'opening quotation: {point.open}<br/>' +
            'the highest: {point.high}<br/>' +
            'the lowest: {point.low}<br/>' +
            'closing quotation: {point.close}<br/>'
            }
        }
    },
    yAxis: [{
        title: {
            text: 'K-line market'
        },
        height: '70%',
        lineWidth: 1
    }, {
        title: {
            text: 'Fisher Transform'
        },
        top: '75%',
        height: '30%',
        offset: 0,
        lineWidth: 1
    }],
    series: [//series
        {
            type: 'candlestick',
            yAxis: 0,
            name: 'K-line',
            id: 'KLine',
            // Control the candle color with downward trend
            color: 'green',
            lineColor: 'green',
            // Control the candle color with upward trend
            upColor: 'red',
            upLineColor: 'red',
            data: []
        },{
            type: 'line',         // Set the current data series type as line
            yAxis: 1,             // The y-axis used as the y-axis with the index of 0 (a highcharts chart can have multiple y-axes, and the y-axis with the index of 0 is specified here)
            showInLegend: true,   //
            name: 'fish',          // Set it according to the parameter label passed in by the function
            lineWidth: 1,
            data: [],             // Data items of data series
            tooltip: {            // Tooltip
                valueDecimals: 2  // The decimal point of the value is reserved for 5 digits
            }
        },{
            type: 'line',         // Set the current data series type as line
            yAxis: 1,             // The y-axis used as the y-axis with the index of 0 (a highcharts chart can have multiple y-axes, and the y-axis with the index of 0 is specified here)
            showInLegend: true,   //
            name: 'preFish',      // Set it according to the parameter label passed in by the function
            lineWidth: 1,
            data: [],             // Data items of data series
            tooltip: {            // Tooltip
                valueDecimals: 2  // The decimal point of the value is reserved for 5 digits
            }
        }
    ]
}

var chart = Chart(cfg)
function main() {
    var ts = 0
    chart.reset()
    while (true) {
        var r = exchange.GetRecords()
        var fisher = calcFisher(r, 0.33, 10)
        if (!r || !fisher) {
            Sleep(500)
            continue
        }

        for (var i = 0; i < r.length; i++){
            if (ts == r[i].Time) {
                chart.add([0,[r[i].Time, r[i].Open, r[i].High, r[i].Low, r[i].Close], -1])
                chart.add([1,[r[i].Time, fisher[i]], -1])
                if (i - 1 >= 0) {
                    chart.add([2,[r[i].Time, fisher[i - 1]], -1])
                }
            }else if (ts < r[i].Time) {
                chart.add([0,[r[i].Time, r[i].Open, r[i].High, r[i].Low, r[i].Close]])
                chart.add([1,[r[i].Time, fisher[i]]])
                if (i - 1 >= 0) {
                    chart.add([2,[r[i].Time, fisher[i - 1]]])
                }
                ts = r[i].Time
            }
        }
    }
}
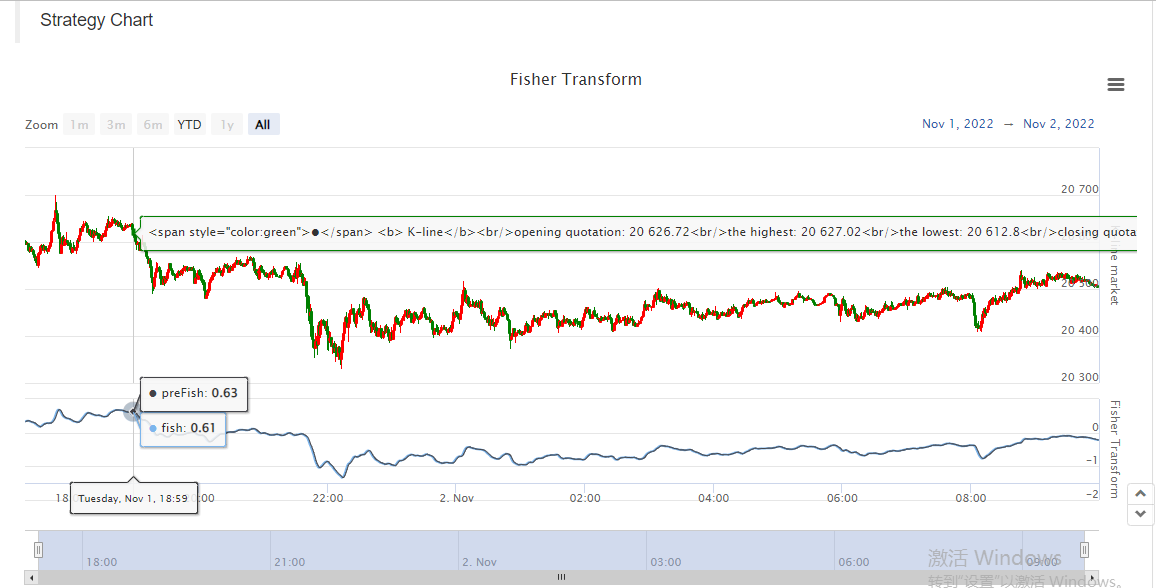
Daher ist es sehr praktisch, Daten, Darstellungsdiagramme und Designstrategie auf FMZ zu studieren. Hier haben wir gerade ein Beispiel gezeigt, ihr könnt gerne eine Nachricht hinterlassen.
- Quantifizierung der Fundamentalanalyse auf dem Kryptowährungsmarkt: Die Daten sprechen für sich!
- Die Quantifizierung der Kernforschung der Münzkreise - nicht mehr auf alle Arten von Lehrern zu vertrauen, die überzeugt sind, dass die Daten objektiv sind!
- Ein wichtiges Werkzeug im Bereich der Quantitative Transaktionen - der Erfinder der Quantitative Data Exploration Module
- Mastering Everything - Einführung in FMZ Neue Version des Handelsterminals (mit TRB Arbitrage Source Code)
- Die neue Version des FMZ-Trading-Terminals ist verfügbar.
- FMZ Quant: Eine Analyse von gemeinsamen Anforderungen Designbeispielen auf dem Kryptowährungsmarkt (II)
- Wie man Hirnlose Verkaufs-Bots mit einer Hochfrequenz-Strategie in 80 Codezeilen ausnutzt
- FMZ-Quantifizierung: Analyse von Designbeispielen für häufige Bedürfnisse im Kryptowährungsmarkt (II)
- Wie man Hirnlose Roboter ausbeuten und verkaufen kann mit einer 80-Zeilen-code-Hochfrequenz-Strategie
- FMZ Quant: Eine Analyse von gemeinsamen Anforderungen Designbeispielen auf dem Kryptowährungsmarkt (I)
- FMZ-Quantifizierung: Analyse von Designbeispielen für häufige Bedürfnisse im Kryptowährungsmarkt