Die "Magische Doppel-EMA-Strategie" von den YouTube-Veteranen
Schriftsteller:Lydia., Erstellt: 2022-11-07 12:02:31, aktualisiert: 2023-09-15 20:51:23
Die Magische Doppel-EMA-Strategie von den YouTube-Veteranen
In dieser Ausgabe werden wir eine
Indikatoren für die Strategie
- EMA-Indikatoren
Um der Einfachheit des Designs willen werden wir nicht die in dem Video aufgeführten exponentiellen gleitenden Durchschnittswerte verwenden, sondern stattdessen das integrierte Ta.ema der Handelsansicht verwenden (es ist eigentlich dasselbe).
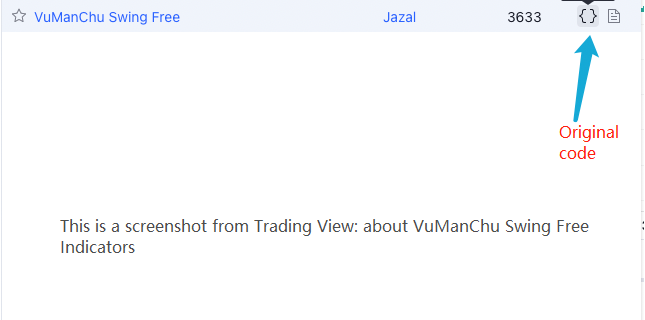
- VuManChu Swing-Free-Indikatoren
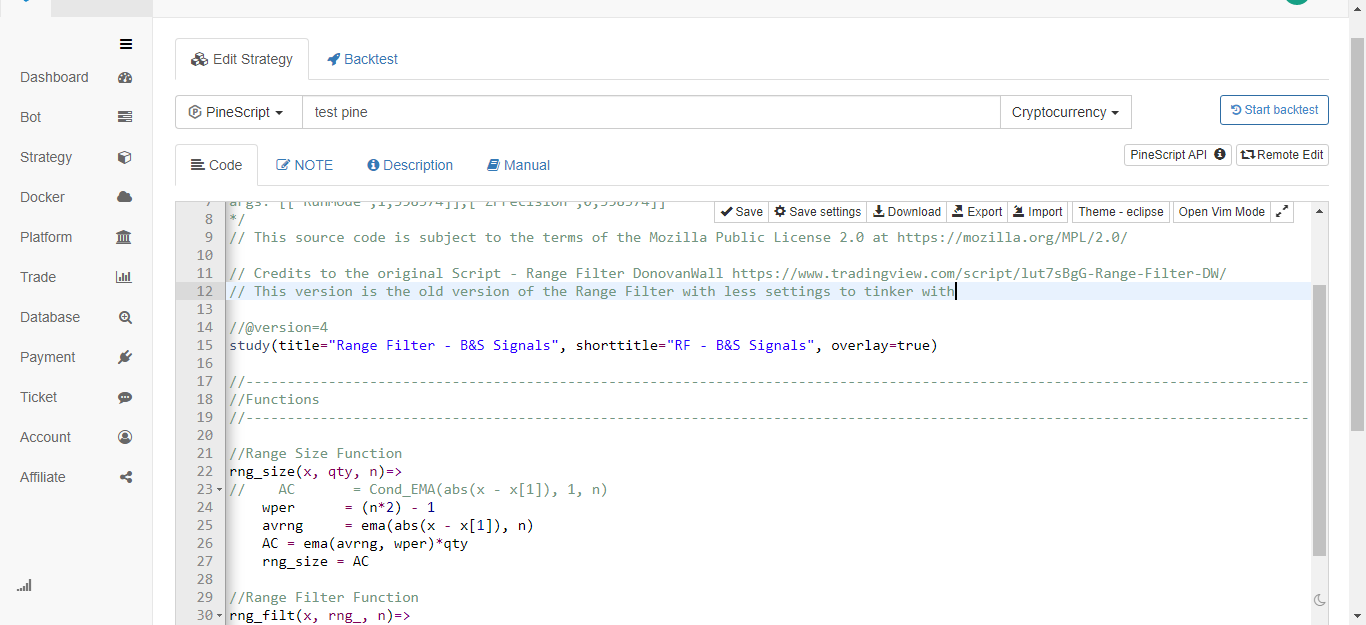
Das ist ein Indikator auf Trading View, wir müssen zu Trading View gehen und den Quellcode abholen.
Code von VuManChu Swing Free:
// This source code is subject to the terms of the Mozilla Public License 2.0 at https://mozilla.org/MPL/2.0/

// Credits to the original Script - Range Filter DonovanWall https://www.tradingview.com/script/lut7sBgG-Range-Filter-DW/
// This version is the old version of the Range Filter with less settings to tinker with

//@version=4
study(title="Range Filter - B&S Signals", shorttitle="RF - B&S Signals", overlay=true)

//-----------------------------------------------------------------------------------------------------------------------------------------------------------------
//Functions
//-----------------------------------------------------------------------------------------------------------------------------------------------------------------

//Range Size Function
rng_size(x, qty, n)=>
//    AC       = Cond_EMA(abs(x - x[1]), 1, n)
    wper      = (n*2) - 1
    avrng     = ema(abs(x - x[1]), n)
    AC = ema(avrng, wper)*qty
    rng_size = AC

//Range Filter Function
rng_filt(x, rng_, n)=>
    r          = rng_
    var rfilt  = array.new_float(2, x)
    array.set(rfilt, 1, array.get(rfilt, 0))
    if x - r > array.get(rfilt, 1)
        array.set(rfilt, 0, x - r)
    if x + r < array.get(rfilt, 1)
        array.set(rfilt, 0, x + r)
    rng_filt1 = array.get(rfilt, 0)

    hi_band   = rng_filt1 + r
    lo_band   = rng_filt1 - r
    rng_filt  = rng_filt1
    [hi_band, lo_band, rng_filt]

//-----------------------------------------------------------------------------------------------------------------------------------------------------------------
//Inputs
//-----------------------------------------------------------------------------------------------------------------------------------------------------------------

//Range Source
rng_src = input(defval=close, type=input.source, title="Swing Source")

//Range Period
rng_per = input(defval=20, minval=1, title="Swing Period")

//Range Size Inputs
rng_qty   = input(defval=3.5, minval=0.0000001, title="Swing Multiplier")

//Bar Colors
use_barcolor = input(defval=false, type=input.bool, title="Bar Colors On/Off")

//-----------------------------------------------------------------------------------------------------------------------------------------------------------------
//Definitions
//-----------------------------------------------------------------------------------------------------------------------------------------------------------------

//Range Filter Values
[h_band, l_band, filt] = rng_filt(rng_src, rng_size(rng_src, rng_qty, rng_per), rng_per)

//Direction Conditions
var fdir = 0.0
fdir    := filt > filt[1] ? 1 : filt < filt[1] ? -1 : fdir
upward   = fdir==1 ? 1 : 0
downward = fdir==-1 ? 1 : 0

//Trading Condition
longCond = rng_src > filt and rng_src > rng_src[1] and upward > 0 or rng_src > filt and rng_src < rng_src[1] and upward > 0
shortCond = rng_src < filt and rng_src < rng_src[1] and downward > 0 or rng_src < filt and rng_src > rng_src[1] and downward > 0

CondIni = 0
CondIni := longCond ? 1 : shortCond ? -1 : CondIni[1]
longCondition = longCond and CondIni[1] == -1
shortCondition = shortCond and CondIni[1] == 1

//Colors
filt_color = upward ? #05ff9b : downward ? #ff0583 : #cccccc
bar_color  = upward and (rng_src > filt) ? (rng_src > rng_src[1] ? #05ff9b : #00b36b) :
             downward and (rng_src < filt) ? (rng_src < rng_src[1] ? #ff0583 : #b8005d) : #cccccc

//-----------------------------------------------------------------------------------------------------------------------------------------------------------------
//Outputs
//-----------------------------------------------------------------------------------------------------------------------------------------------------------------

//Filter Plot
filt_plot = plot(filt, color=filt_color, transp=67, linewidth=3, title="Filter")

//Band Plots
h_band_plot = plot(h_band, color=color.new(#05ff9b, 100), title="High Band")
l_band_plot = plot(l_band, color=color.new(#ff0583, 100), title="Low Band")

//Band Fills
fill(h_band_plot, filt_plot, color=color.new(#00b36b, 92), title="High Band Fill")
fill(l_band_plot, filt_plot, color=color.new(#b8005d, 92), title="Low Band Fill")

//Bar Color
barcolor(use_barcolor ? bar_color : na)

//Plot Buy and Sell Labels
plotshape(longCondition, title = "Buy Signal", text ="BUY", textcolor = color.white, style=shape.labelup, size = size.normal, location=location.belowbar, color = color.new(color.green, 0))
plotshape(shortCondition, title = "Sell Signal", text ="SELL", textcolor = color.white, style=shape.labeldown, size = size.normal, location=location.abovebar, color = color.new(color.red, 0))

//Alerts
alertcondition(longCondition, title="Buy Alert", message = "BUY")
alertcondition(shortCondition, title="Sell Alert", message = "SELL")
Strategie Logik
EMA-Indikator: Die Strategie verwendet zwei EMAs, eine ist die schnelle Linie (Kleinerzeitparameter) und die andere ist die langsame Linie (großer Zeitraumparameter).
-
langfristige Positionsregelung Die schnelle Linie ist über der langsamen Linie.
-
kurzfristige Positionsregelung Die schnelle Linie ist unter der langsamen Linie.
VuManChu Swing Free Indicator: Der VuManChu Swing Free Indikator wird verwendet, um Signale zu senden und zu beurteilen, ob eine Bestellung in Kombination mit anderen Bedingungen platziert werden soll.
Lassen Sie uns nun über die spezifischen Auslöserbedingungen des Handelssignals sprechen:
-
Regeln für den Einstieg in eine Longposition: Der Schlusskurs der positiven K-Linie sollte über der schnellen Linie des EMA liegen, die beiden EMA sollten eine Long-Position sein (schnelle Linie über der langsamen Linie) und der VuManChu Swing Free-Indikator sollte ein Kaufsignal zeigen (longCondition ist wahr).
-
Regeln für den Einstieg in eine Short-Position (im Gegensatz zur Long-Position): Der Schlusskurs der negativen K-Linie sollte unterhalb der schnellen Linie des EMA liegen, die beiden EMA sollten eine Short-Position sein (schnelle Linie unterhalb der langsamen Linie) und der VuManChu Swing Free-Indikator sollte ein Verkaufssignal zeigen (shortCondition ist wahr).
Ist die Handelslogik sehr einfach? Da das Quellvideo den Profit-Stop und den Loss-Stop nicht angibt, werde ich eine moderate Profit-Stop- und Loss-Stop-Methode frei verwenden, wobei feste Punkte zum Stop-Loss verwendet werden und der Profit-Stop verfolgt wird.
Entwurf des Codes
Der Code für den VuManChu Swing Free Indikator, wir haben ihn direkt in unseren Strategie-Code eingegeben ohne jede Änderung.
Unmittelbar danach schreiben wir ein Stück Code in der Pine-Sprache, das die Handelsfunktion implementiert:
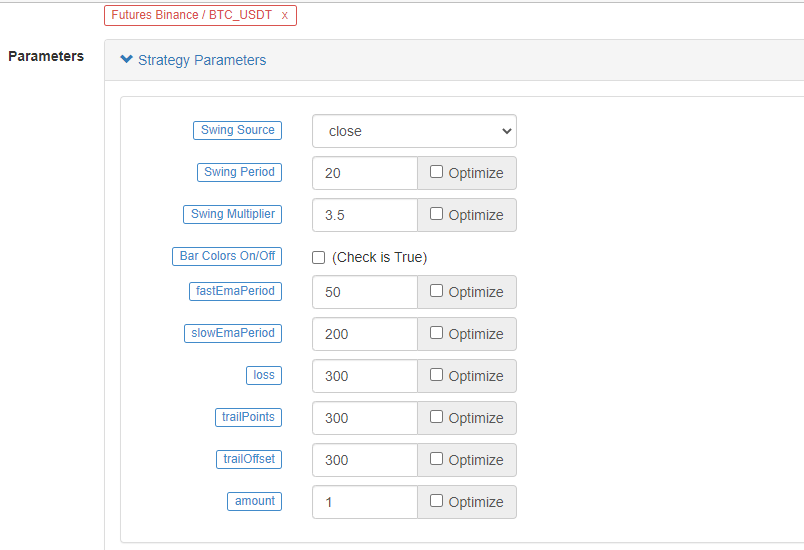
// extend
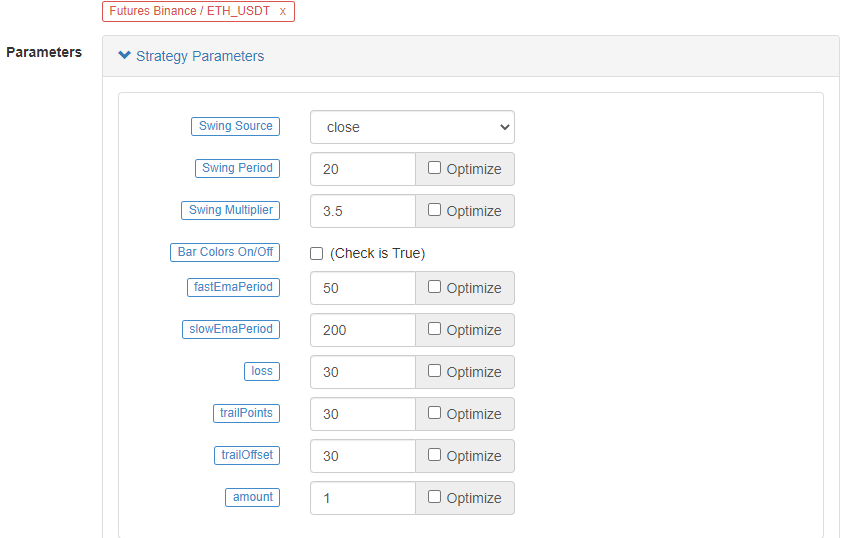
fastEmaPeriod = input(50, "fastEmaPeriod") // fast line period
slowEmaPeriod = input(200, "slowEmaPeriod") // slow line period
loss = input(30, "loss") // stop loss points
trailPoints = input(30, "trailPoints") // number of trigger points for moving stop loss
trailOffset = input(30, "trailOffset") // moving stop profit offset (points)
amount = input(1, "amount") // order amount
emaFast = ta.ema(close, fastEmaPeriod) // calculate the fast line EMA
emaSlow = ta.ema(close, slowEmaPeriod) // calculate the slow line EMA
buyCondition = longCondition and emaFast > emaSlow and close > open and close > emaFast // entry conditions for long positions
sellCondition = shortCondition and emaFast < emaSlow and close < open and close < emaFast // entry conditions for short positions
if buyCondition and strategy.position_size == 0
strategy.entry("long", strategy.long, amount)
strategy.exit("exit_long", "long", amount, loss=loss, trail_points=trailPoints, trail_offset=trailOffset)
if sellCondition and strategy.position_size == 0
strategy.entry("short", strategy.short, amount)
strategy.exit("exit_short", "short", amount, loss=loss, trail_points=trailPoints, trail_offset=trailOffset)
A.ItWir können sehen, dass wenn buyCondition wahr ist, das heißt:
- Variable longCondition ist wahr (Der VuManChu Swing Free-Indikator sendet ein Long-Positionssignal).
- EmaFast > emaSlow (EMA-Langstellungsausrichtung).
- close > open (bedeutet, dass der aktuelle BAR positiv ist), close > emaFast (bedeutet, dass der Schlusskurs über der EMA-Schnelllinie liegt).
Die drei Voraussetzungen für eine lange Haltbarkeit.
B.Wenn die SellCondition wahr ist, gelten die drei Bedingungen für eine Shortposition (hier nicht wiederholt).
Dann verwenden wir die Strategie.Entry-Funktion, um eine Position im Falle eines If-Condition-Urteilssignals einzugeben und zu öffnen.strategy.exitFunktion, um Verluste zu stoppen und gleichzeitig Gewinn zu erzielen.
Vollständiger Code
/*backtest
start: 2022-01-01 00:00:00
end: 2022-10-08 00:00:00
period: 15m
basePeriod: 5m
exchanges: [{"eid":"Futures_Binance","currency":"ETH_USDT"}]
args: [["ZPrecision",0,358374]]
*/

// This source code is subject to the terms of the Mozilla Public License 2.0 at https://mozilla.org/MPL/2.0/

// Credits to the original Script - Range Filter DonovanWall https://www.tradingview.com/script/lut7sBgG-Range-Filter-DW/
// This version is the old version of the Range Filter with less settings to tinker with

//@version=4
study(title="Range Filter - B&S Signals", shorttitle="RF - B&S Signals", overlay=true)

//-----------------------------------------------------------------------------------------------------------------------------------------------------------------
//Functions
//-----------------------------------------------------------------------------------------------------------------------------------------------------------------

//Range Size Function
rng_size(x, qty, n)=>
//    AC       = Cond_EMA(abs(x - x[1]), 1, n)
    wper      = (n*2) - 1
    avrng     = ema(abs(x - x[1]), n)
    AC = ema(avrng, wper)*qty
    rng_size = AC

//Range Filter Function
rng_filt(x, rng_, n)=>
    r          = rng_
    var rfilt  = array.new_float(2, x)
    array.set(rfilt, 1, array.get(rfilt, 0))
    if x - r > array.get(rfilt, 1)
        array.set(rfilt, 0, x - r)
    if x + r < array.get(rfilt, 1)
        array.set(rfilt, 0, x + r)
    rng_filt1 = array.get(rfilt, 0)

    hi_band   = rng_filt1 + r
    lo_band   = rng_filt1 - r
    rng_filt  = rng_filt1
    [hi_band, lo_band, rng_filt]

//-----------------------------------------------------------------------------------------------------------------------------------------------------------------
//Inputs
//-----------------------------------------------------------------------------------------------------------------------------------------------------------------

//Range Source
rng_src = input(defval=close, type=input.source, title="Swing Source")

//Range Period
rng_per = input(defval=20, minval=1, title="Swing Period")

//Range Size Inputs
rng_qty   = input(defval=3.5, minval=0.0000001, title="Swing Multiplier")

//Bar Colors
use_barcolor = input(defval=false, type=input.bool, title="Bar Colors On/Off")

//-----------------------------------------------------------------------------------------------------------------------------------------------------------------
//Definitions
//-----------------------------------------------------------------------------------------------------------------------------------------------------------------

//Range Filter Values
[h_band, l_band, filt] = rng_filt(rng_src, rng_size(rng_src, rng_qty, rng_per), rng_per)

//Direction Conditions
var fdir = 0.0
fdir    := filt > filt[1] ? 1 : filt < filt[1] ? -1 : fdir
upward   = fdir==1 ? 1 : 0
downward = fdir==-1 ? 1 : 0

//Trading Condition
longCond = rng_src > filt and rng_src > rng_src[1] and upward > 0 or rng_src > filt and rng_src < rng_src[1] and upward > 0
shortCond = rng_src < filt and rng_src < rng_src[1] and downward > 0 or rng_src < filt and rng_src > rng_src[1] and downward > 0

CondIni = 0
CondIni := longCond ? 1 : shortCond ? -1 : CondIni[1]
longCondition = longCond and CondIni[1] == -1
shortCondition = shortCond and CondIni[1] == 1

//Colors
filt_color = upward ? #05ff9b : downward ? #ff0583 : #cccccc
bar_color  = upward and (rng_src > filt) ? (rng_src > rng_src[1] ? #05ff9b : #00b36b) :
             downward and (rng_src < filt) ? (rng_src < rng_src[1] ? #ff0583 : #b8005d) : #cccccc

//-----------------------------------------------------------------------------------------------------------------------------------------------------------------
//Outputs
//-----------------------------------------------------------------------------------------------------------------------------------------------------------------

//Filter Plot
filt_plot = plot(filt, color=filt_color, transp=67, linewidth=3, title="Filter")

//Band Plots
h_band_plot = plot(h_band, color=color.new(#05ff9b, 100), title="High Band")
l_band_plot = plot(l_band, color=color.new(#ff0583, 100), title="Low Band")

//Band Fills
fill(h_band_plot, filt_plot, color=color.new(#00b36b, 92), title="High Band Fill")
fill(l_band_plot, filt_plot, color=color.new(#b8005d, 92), title="Low Band Fill")

//Bar Color
barcolor(use_barcolor ? bar_color : na)

//Plot Buy and Sell Labels
plotshape(longCondition, title = "Buy Signal", text ="BUY", textcolor = color.white, style=shape.labelup, size = size.normal, location=location.belowbar, color = color.new(color.green, 0))
plotshape(shortCondition, title = "Sell Signal", text ="SELL", textcolor = color.white, style=shape.labeldown, size = size.normal, location=location.abovebar, color = color.new(color.red, 0))

//Alerts
alertcondition(longCondition, title="Buy Alert", message = "BUY")
alertcondition(shortCondition, title="Sell Alert", message = "SELL")


// extend
fastEmaPeriod = input(50, "fastEmaPeriod")
slowEmaPeriod = input(200, "slowEmaPeriod")
loss = input(30, "loss")
trailPoints = input(30, "trailPoints")
trailOffset = input(30, "trailOffset")
amount = input(1, "amount")

emaFast = ta.ema(close, fastEmaPeriod)
emaSlow = ta.ema(close, slowEmaPeriod)

buyCondition = longCondition and emaFast > emaSlow and close > open and close > emaFast
sellCondition = shortCondition and emaFast < emaSlow and close < open and close < emaFast

if buyCondition and strategy.position_size == 0
    strategy.entry("long", strategy.long, amount)
    strategy.exit("exit_long", "long", amount, loss=loss, trail_points=trailPoints, trail_offset=trailOffset)
if sellCondition and strategy.position_size == 0
    strategy.entry("short", strategy.short, amount)
    strategy.exit("exit_short", "short", amount, loss=loss, trail_points=trailPoints, trail_offset=trailOffset)
Zurückprüfung
Der Zeitrahmen des Backtests beträgt von Januar 2022 bis Oktober 2022. Die K-Linienperiode beträgt 15 Minuten und das Schlusskursmodell wird für den Backtest verwendet. Der Markt wählt den Binance ETH_USDT-Perpetual Contract. Die Parameter werden nach den 50 Perioden der schnellen Linie und 200 Perioden der langsamen Linie im Quellvideo festgelegt. Die anderen Parameter bleiben standardmäßig unverändert. Ich habe Stop-Loss- und Tracking-Stop-Profit-Punkte subjektiv auf 30 Punkte gesetzt.
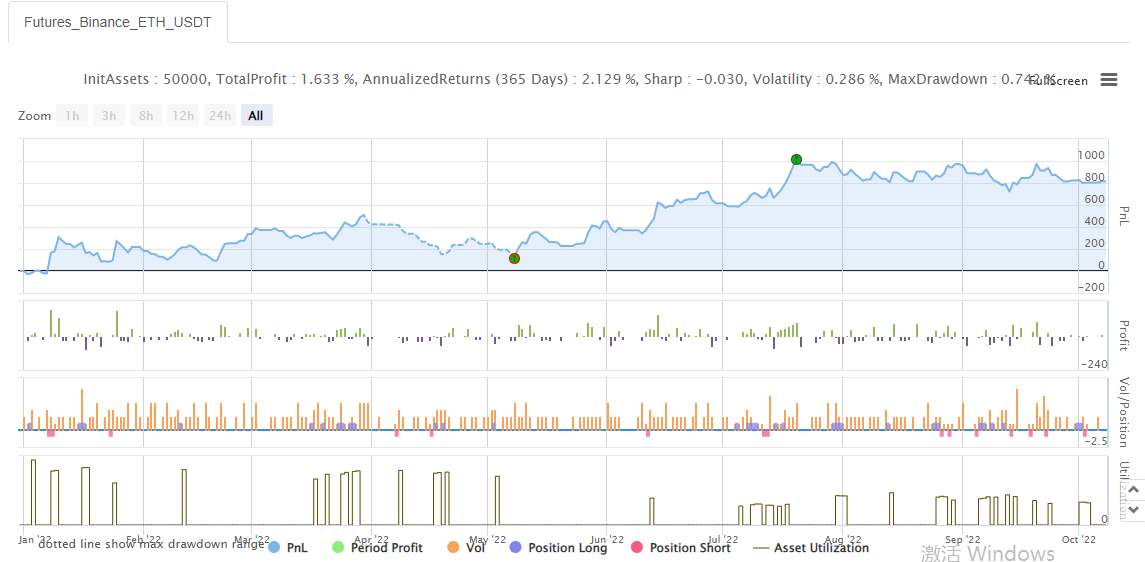
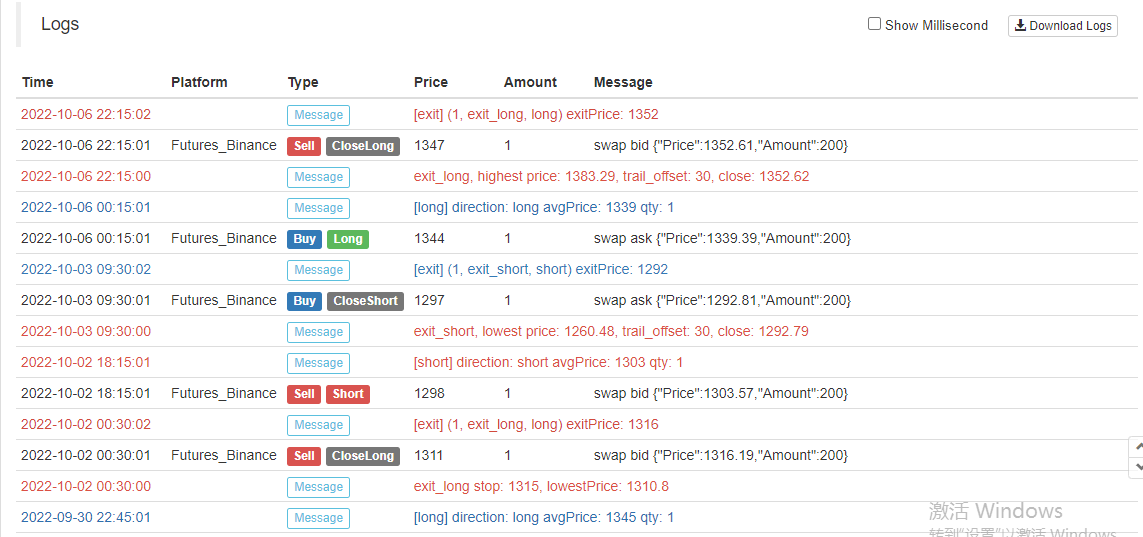
Die Ergebnisse des Backtestings sind normal und es scheint, dass die Stop-Loss-Parameter einen gewissen Einfluss auf die Ergebnisse des Backtestings haben. Ich denke, dass dieser Aspekt noch optimiert und konzipiert werden muss.
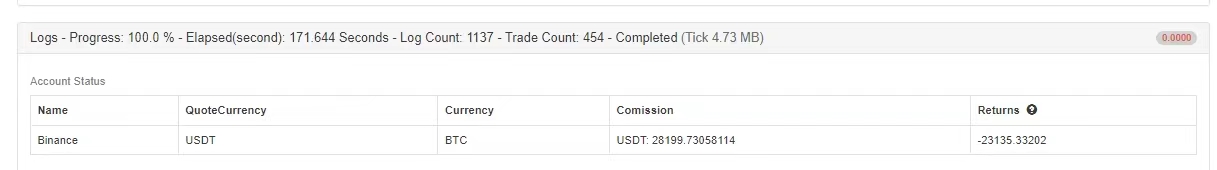
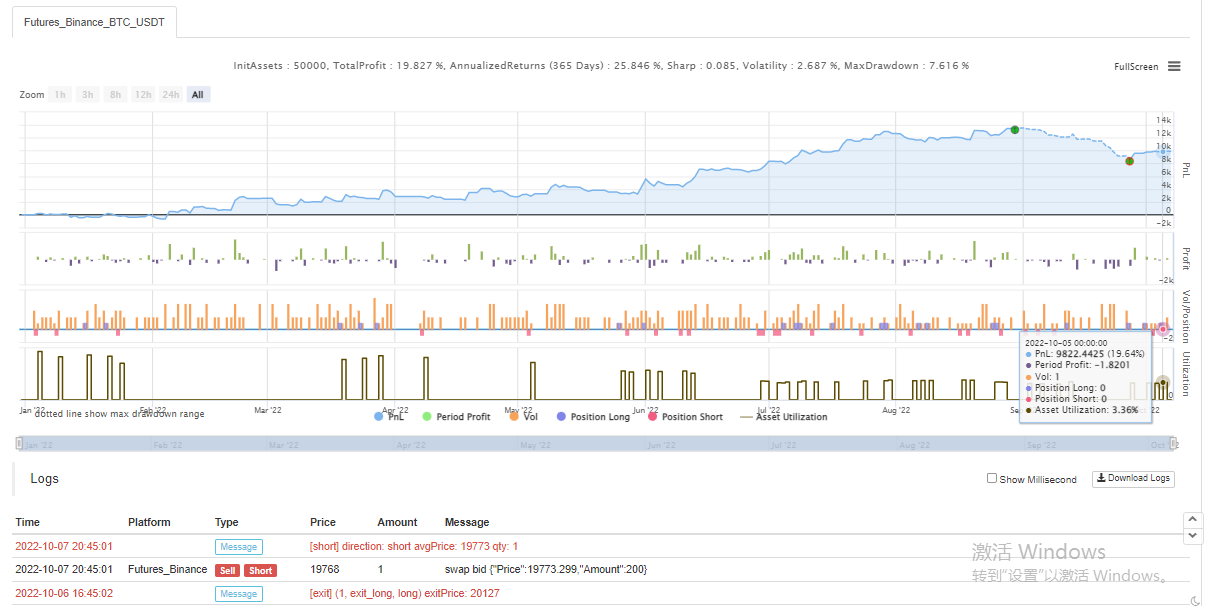
Versuchen wir einen anderen BTC_USDT-Perpetual-Kontrakt:
Das Ergebnis des Backtests auf BTC war ebenfalls sehr profitabel:
Strategie von:https://www.fmz.com/strategy/385745
Es scheint, dass diese Handelsmethode relativ zuverlässig ist, um den Trend zu erfassen, Sie können das Design nach dieser Idee weiter optimieren. In diesem Artikel haben wir nicht nur die Idee einer doppelten gleitenden Durchschnittsstrategie gelernt, sondern auch gelernt, wie man die Strategie der Veteranen auf YouTube verarbeitet und lernt. OK, der obige Strategiecode ist nur mein Ziegel und Mörtel, die Backtest-Ergebnisse repräsentieren nicht die spezifischen Real-Bot-Ergebnisse, der Strategiecode, das Design ist nur zur Referenz. Vielen Dank für Ihre Unterstützung, wir sehen uns beim nächsten Mal!
- Quantifizierung der Fundamentalanalyse auf dem Kryptowährungsmarkt: Die Daten sprechen für sich!
- Die Quantifizierung der Kernforschung der Münzkreise - nicht mehr auf alle Arten von Lehrern zu vertrauen, die überzeugt sind, dass die Daten objektiv sind!
- Ein wichtiges Werkzeug im Bereich der Quantitative Transaktionen - der Erfinder der Quantitative Data Exploration Module
- Mastering Everything - Einführung in FMZ Neue Version des Handelsterminals (mit TRB Arbitrage Source Code)
- Die neue Version des FMZ-Trading-Terminals ist verfügbar.
- FMZ Quant: Eine Analyse von gemeinsamen Anforderungen Designbeispielen auf dem Kryptowährungsmarkt (II)
- Wie man Hirnlose Verkaufs-Bots mit einer Hochfrequenz-Strategie in 80 Codezeilen ausnutzt
- FMZ-Quantifizierung: Analyse von Designbeispielen für häufige Bedürfnisse im Kryptowährungsmarkt (II)
- Wie man Hirnlose Roboter ausbeuten und verkaufen kann mit einer 80-Zeilen-code-Hochfrequenz-Strategie
- FMZ Quant: Eine Analyse von gemeinsamen Anforderungen Designbeispielen auf dem Kryptowährungsmarkt (I)
- FMZ-Quantifizierung: Analyse von Designbeispielen für häufige Bedürfnisse im Kryptowährungsmarkt