Futures für digitale Währungen - Multi-Species-ATR-Strategie (Tutorial)
Schriftsteller:Lydia., Erstellt: 2022-11-08 10:34:22, Aktualisiert: 2023-09-15 20:55:33
In letzter Zeit freuen sich einige unserer Plattformbenutzer darauf, eine MyLanguage-Strategie in eine JavaScript-Strategie zu transplantieren, die viele Optimierungsideen flexibel hinzufügen kann. Sie erweitern sogar die Strategie auf Multi-Species-Versionen. Weil die MyLanguage-Strategie normalerweise eine Trendstrategie ist und viele von ihnen auf dem Schlusspreismodell basierend ausgeführt werden. Die API-Schnittstelle des Strategieanforderungsaustauschs ist nicht sehr häufig, was für die Transplantation in eine Multi-Species-Strategieversion geeignet ist. In diesem Artikel werden wir eine einfache MyLanguage-Strategie als Beispiel nehmen, um sie in eine einfache Version der JavaScript-Sprache zu transplantieren. Der Hauptzweck ist die Lehre und Unterstützung der Forschung. Wenn Sie einen echten Bot machen möchten, müssen Sie möglicherweise einige Details hinzufügen (Testpreis, Quantitätsgenauigkeit, Bestellmengewicht, Bestellkontrolle nach Vermögenswerten, Anzeige
Die Strategie der MyLanguage, die umgesetzt werden soll
TR:=MAX(MAX((H-L),ABS(REF(C,1)-H)),ABS(REF(C,1)-L));
ATR:=EMA(TR,LENGTH2);

MIDLINE^^EMA((H + L + C)/3,LENGTH1);
UPBAND^^MIDLINE + N*ATR;
DOWNBAND^^MIDLINE - N*ATR;


BKVOL=0 AND C>=UPBAND AND REF(C,1)<REF(UPBAND,1),BPK;
SKVOL=0 AND C<=DOWNBAND AND REF(C,1)>REF(DOWNBAND,1),SPK;

BKVOL>0 AND C<=MIDLINE,SP(BKVOL);
SKVOL>0 AND C>=MIDLINE,BP(SKVOL);
// stop loss
// stop loss
C>=SKPRICE*(1+SLOSS*0.01),BP;
C<=BKPRICE*(1-SLOSS*0.01),SP;
AUTOFILTER;
Die Handelslogik dieser Strategie ist einfach. Erstens berechnen Sie den ATR nach den Parametern, berechnen Sie dann den Durchschnitt der höchsten, niedrigsten und Schlusskosten aller K-Line-BARs und berechnen Sie dann den EMA-Indikator nach den Durchschnittsdaten. Schließlich kombinieren Sie den ATR und den Koeffizienten N in den Parametern, um den UpBand und den DownBand zu berechnen.
Eröffnungs- und Verkaufspositionen basieren auf dem Schlusskurs. Eröffnen Sie lange Positionen, wenn sie den UpBand übersteigen und verkaufen Sie die Eröffnungsposition (wenn Sie Short-Positionen halten). Eröffnen Sie kurze Positionen, wenn sie den DownBand übersteigen und verkaufen Sie die Eröffnungsposition. Wenn der Schlusskurs die Mittellinie erreicht, wird die Position geschlossen, und wenn der Schlusskurs den Stop-Loss-Kurs erreicht, wird die Position ebenfalls geschlossen (Stop-Loss laut SLOSS beträgt 1, d. h. 0,01, d. h. 1%). Die Strategie wird in einem Schlusskursmodell ausgeführt.
OK, wenn wir die strategischen Anforderungen und Ideen von MyLanguage verstehen, können wir anfangen, sie zu transplantieren.
Prototyp der Transplantations- und Konstruktionsstrategie
Es gibt nicht viele Strategie-Prototypencodes, die von 1 bis 200 Zeilen reichen.
// parse params parameters, and parse strings as objects
var arrParam = JSON.parse(params)

// this function creates a chart configuration
function createChartConfig(symbol, atrPeriod, emaPeriod, index) {   // symbol : trading pair, atrPeriod : ATR parameter period , emaPeriod : EMA parameter period, exchange object index corresponding to index
    var chart = {
        __isStock: true,
        extension: {
                layout: 'single',
                height: 600,
        },
        title : { text : symbol},
        xAxis: { type: 'datetime'},
        series : [
            {
                type: 'candlestick',    // K-line data series
                name: symbol,
                id: symbol + "-" + index,
                data: []
            }, {
                type: 'line',           // EMA
                name: symbol + ',EMA:' + emaPeriod,
                data: [],
            }, {
                type: 'line',           // upBand
                name: symbol + ',upBand' + atrPeriod,
                data: []
            }, {
                type: 'line',           // downBand
                name: symbol + ',downBand' + atrPeriod,
                data: []
            }, {
                type: 'flags',
                onSeries: symbol + "-" + index,
                data: [],
            }
        ]
    }
    return chart
}

// main Logic
function process(e, kIndex, c) {    // e is the exchange object, exchanges [0]..., kIndex is the K-line data series in the chart, and c is the chart object
    // obtain K-line data
    var r = e.GetRecords(e.param.period)
    if (!r || r.length < e.param.atrPeriod + 2 || r.length < e.param.emaPeriod + 2) {
        // if the K-line data length is insufficient, return
        return
    }

    // calculate ATR indicators
    var atr = TA.ATR(r, e.param.atrPeriod)
    var arrAvgPrice = []
    _.each(r, function(bar) {
        arrAvgPrice.push((bar.High + bar.Low + bar.Close) / 3)
    })
    // calculate EMA indicators
    var midLine = TA.EMA(arrAvgPrice, e.param.emaPeriod)
    // calculate upBand and downBand
    var upBand = []
    var downBand = []
    _.each(midLine, function(mid, index) {
        if (index < e.param.emaPeriod - 1 || index < e.param.atrPeriod - 1) {
            upBand.push(NaN)
            downBand.push(NaN)
            return
        }
        upBand.push(mid + e.param.trackRatio * atr[index])
        downBand.push(mid - e.param.trackRatio * atr[index])
    })

    // draw the chart
    for (var i = 0 ; i < r.length ; i++) {
        if (r[i].Time == e.state.lastBarTime) {
            // update
            c.add(kIndex, [r[i].Time, r[i].Open, r[i].High, r[i].Low, r[i].Close], -1)
            c.add(kIndex + 1, [r[i].Time, midLine[i]], -1)
            c.add(kIndex + 2, [r[i].Time, upBand[i]], -1)
            c.add(kIndex + 3, [r[i].Time, downBand[i]], -1)
        } else if (r[i].Time > e.state.lastBarTime) {
            // add
            e.state.lastBarTime = r[i].Time
            c.add(kIndex, [r[i].Time, r[i].Open, r[i].High, r[i].Low, r[i].Close])
            c.add(kIndex + 1, [r[i].Time, midLine[i]])
            c.add(kIndex + 2, [r[i].Time, upBand[i]])
            c.add(kIndex + 3, [r[i].Time, downBand[i]])
        }
    }

    // check the position
    var pos = e.GetPosition()
    if (!pos) {
        return
    }
    var holdAmount = 0
    var holdPrice = 0
    if (pos.length > 1) {
        throw "long and short positions are checked at the same time!"
    } else if (pos.length != 0) {
        holdAmount = pos[0].Type == PD_LONG ? pos[0].Amount : -pos[0].Amount
        holdPrice = pos[0].Price
    }

    if (e.state.preBar == -1) {
        e.state.preBar = r[r.length - 1].Time
    }
    // check the signal
    if (e.state.preBar != r[r.length - 1].Time) {   // closing price model
        if (holdAmount <= 0 && r[r.length - 3].Close < upBand[upBand.length - 3] && r[r.length - 2].Close > upBand[upBand.length - 2]) {   // the closing price cross over the upBand
            if (holdAmount < 0) {   // hold a short positions, close them
                Log(e.GetCurrency(), "close short positions", "#FF0000")
                $.CoverShort(e, e.param.symbol, Math.abs(holdAmount))
                c.add(kIndex + 4, {x: r[r.length - 2].Time, color: 'red', shape: 'flag', title: 'close', text: "close short positions"})
            }
            // open long positions
            Log(e.GetCurrency(), "open long positions", "#FF0000")
            $.OpenLong(e, e.param.symbol, 10)
            c.add(kIndex + 4, {x: r[r.length - 2].Time, color: 'red', shape: 'flag', title: 'long', text: "open long positions"})
        } else if (holdAmount >= 0 && r[r.length - 3].Close > downBand[downBand.length - 3] && r[r.length - 2].Close < downBand[downBand.length - 2]) {  // the closing price cross down the downBand
            if (holdAmount > 0) {   // hold long positions, close them
                Log(e.GetCurrency(), "close long positions", "#FF0000")
                $.CoverLong(e, e.param.symbol, Math.abs(holdAmount))
                c.add(kIndex + 4, {x: r[r.length - 2].Time, color: 'green', shape: 'flag', title: 'close', text: "close long positions"})
            }
            // open short positions
            Log(e.GetCurrency(), "open short positions", "#FF0000")
            $.OpenShort(e, e.param.symbol, 10)
            c.add(kIndex + 4, {x: r[r.length - 2].Time, color: 'green', shape: 'flag', title: 'short', text: "open short positions"})
        } else {
            // close positions
            if (holdAmount > 0 && (r[r.length - 2].Close <= holdPrice * (1 - e.param.stopLoss) || r[r.length - 2].Close <= midLine[midLine.length - 2])) {   // Hold a long position, the closing price is less than or equal to the midline, stop loss at the opening price
                Log(e.GetCurrency(), "trigger midline or stop loss, close long positions", "#FF0000")
                $.CoverLong(e, e.param.symbol, Math.abs(holdAmount))
                c.add(kIndex + 4, {x: r[r.length - 2].Time, color: 'green', shape: 'flag', title: 'close', text: "close long positions"})
            } else if (holdAmount < 0 && (r[r.length - 2].Close >= holdPrice * (1 + e.param.stopLoss) || r[r.length - 2].Close >= midLine[midLine.length - 2])) {  // Hold a short position, the closing price is greater than or equal to the midline, stop loss at the opening price
                Log(e.GetCurrency(), "trigger midline or stop loss, close short positions", "#FF0000")
                $.CoverShort(e, e.param.symbol, Math.abs(holdAmount))
                c.add(kIndex + 4, {x: r[r.length - 2].Time, color: 'red', shape: 'flag', title: 'close', text: "close short positions"})
            }
        }
        e.state.preBar = r[r.length - 1].Time
    }
}

function main() {
    var arrChartConfig = []
    if (arrParam.length != exchanges.length) {
        throw "Parameters and exchange objects do not match!"
    }
    var arrState = _G("arrState")
    _.each(exchanges, function(e, index) {
        if (e.GetName() != "Futures_Binance") {
            throw "The exchange is not supported!"
        }
        e.param = arrParam[index]
        e.state = {lastBarTime: 0, symbol: e.param.symbol, currency: e.GetCurrency()}
        if (arrState) {
            if (arrState[index].symbol == e.param.symbol && arrState[index].currency == e.GetCurrency()) {
                Log("restore:", e.state)
                e.state = arrState[index]
            } else {
                throw "The restored data does not match the current settings!"
            }
        }
        e.state.preBar = -1   // initial setting -1
        e.SetContractType(e.param.symbol)
        Log(e.GetName(), e.GetLabel(), "set contracts:", e.param.symbol)
        arrChartConfig.push(createChartConfig(e.GetCurrency(), e.param.atrPeriod, e.param.emaPeriod, index))
    })
    var chart = Chart(arrChartConfig)
    chart.reset()

    while (true) {
        _.each(exchanges, function(e, index) {
            process(e, index + index * 4, chart)
            Sleep(500)
        })
    }
}

function onexit() {
    // record e.state
    var arrState = []
    _.each(exchanges, function(e) {
        arrState.push(e.state)
    })
    Log("record:", arrState)
    _G("arrState", arrState)
}
Strategieparameter:
var params = '[{
        "symbol" : "swap",    // contract code
        "period" : 86400,     // K-line period, 86,400 seconds is a day
        "stopLoss" : 0.07,    // stop loss factor, 0.07 or 7%
        "atrPeriod" : 10,     // ATR indicator parameters
        "emaPeriod" : 10,     // EMA indicator parameters
        "trackRatio" : 1,     // upBand and downBand coefficients
        "openRatio" : 0.1     // The reserved opening percentage, which is not supported for now
    }, {
        "symbol" : "swap",
        "period" : 86400,
        "stopLoss" : 0.07,
        "atrPeriod" : 10,
        "emaPeriod" : 10,
        "trackRatio" : 1,
        "openRatio" : 0.1
    }]'
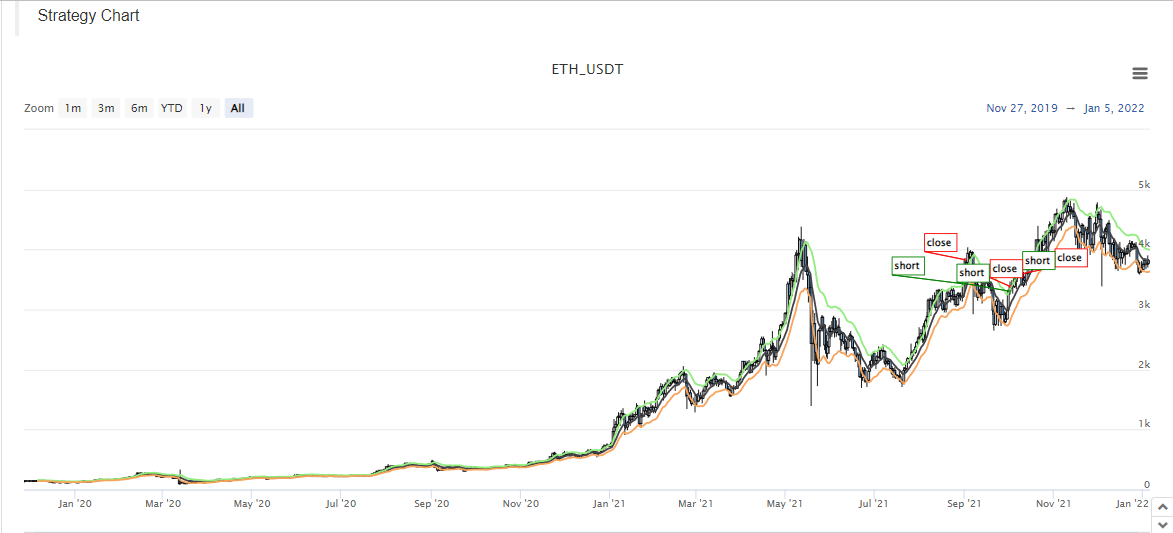
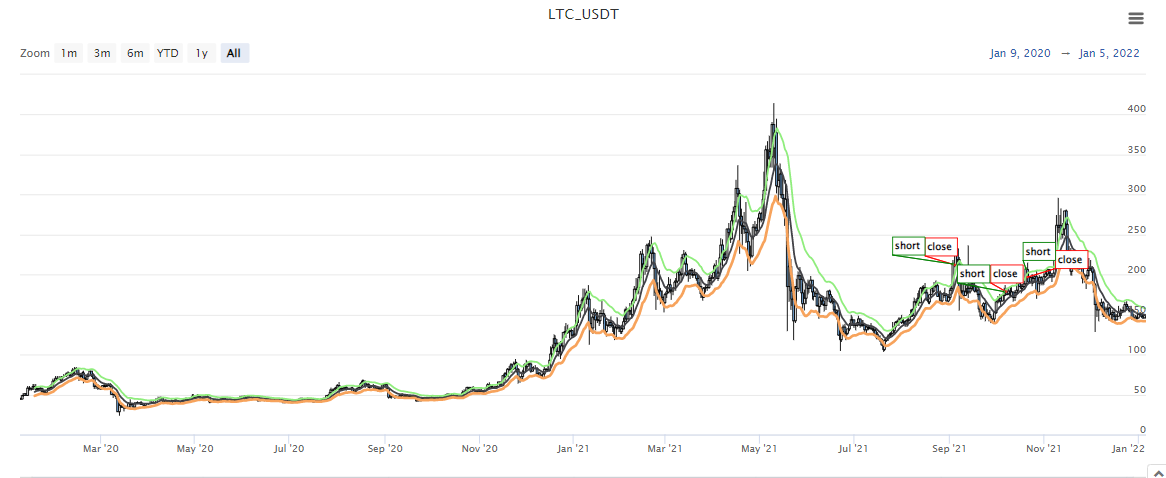
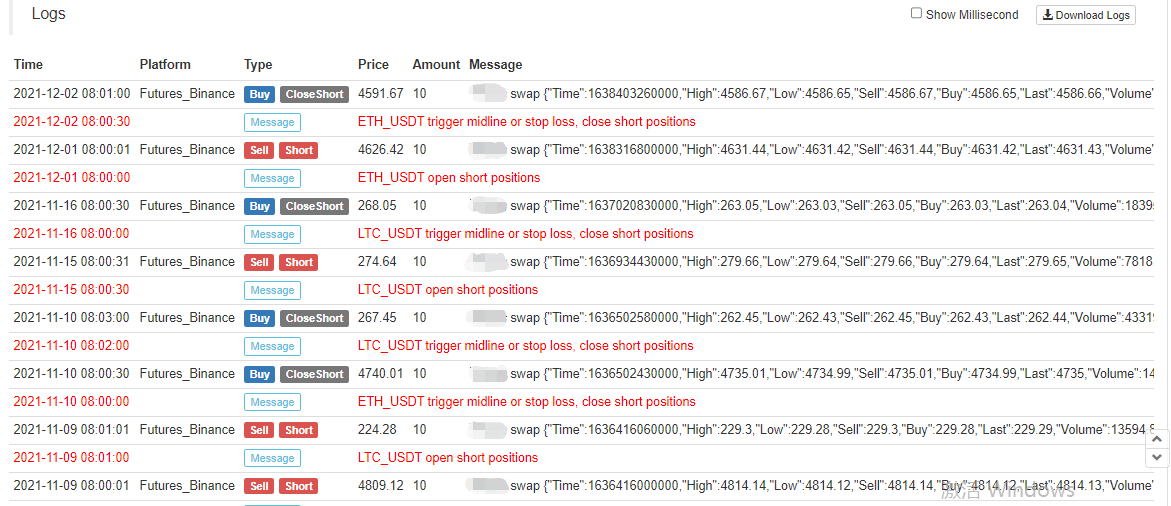
Backtest-Screenshots:
Strategie-Quellcode:https://www.fmz.com/strategy/339344
Die Strategien sind nur für Backtesting und Lernforschung bestimmt. Bitte modifizieren, optimieren und beziehen Sie sich selbst auf den echten Bot.
- Quantifizierung der Fundamentalanalyse auf dem Kryptowährungsmarkt: Die Daten sprechen für sich!
- Die Quantifizierung der Kernforschung der Münzkreise - nicht mehr auf alle Arten von Lehrern zu vertrauen, die überzeugt sind, dass die Daten objektiv sind!
- Ein wichtiges Werkzeug im Bereich der Quantitative Transaktionen - der Erfinder der Quantitative Data Exploration Module
- Mastering Everything - Einführung in FMZ Neue Version des Handelsterminals (mit TRB Arbitrage Source Code)
- Die neue Version des FMZ-Trading-Terminals ist verfügbar.
- FMZ Quant: Eine Analyse von gemeinsamen Anforderungen Designbeispielen auf dem Kryptowährungsmarkt (II)
- Wie man Hirnlose Verkaufs-Bots mit einer Hochfrequenz-Strategie in 80 Codezeilen ausnutzt
- FMZ-Quantifizierung: Analyse von Designbeispielen für häufige Bedürfnisse im Kryptowährungsmarkt (II)
- Wie man Hirnlose Roboter ausbeuten und verkaufen kann mit einer 80-Zeilen-code-Hochfrequenz-Strategie
- FMZ Quant: Eine Analyse von gemeinsamen Anforderungen Designbeispielen auf dem Kryptowährungsmarkt (I)
- FMZ-Quantifizierung: Analyse von Designbeispielen für häufige Bedürfnisse im Kryptowährungsmarkt