Sie lernen, Multi-Chart-Unterstützung der Strategie hinzuzufügen
Schriftsteller:Lydia., Erstellt: 2022-12-26 11:28:50, Aktualisiert: 2023-09-20 09:52:47
Sie lernen, Multi-Chart-Unterstützung der Strategie hinzuzufügen
Vor allem beim Schreiben von Trendstrategien sind Sie manchmal durch die Auslöserbedingungen verschiedener Indikatoren verwirrt. Zu diesem Zeitpunkt ist es dringend notwendig, die Daten für die Analyse und Ansicht zu visualisieren. Wenn Sie einem Strategie ein einzelnes Chart hinzufügen, können Sie die
Hier ist ein Beispiel zur Referenz. Ich werde die Beispielcode Zeile für Zeile kommentieren. Wenn Sie den Code fertig gelesen haben, werden Sie ein neues Verständnis haben, wie Sie der Strategie Diagrammunterstützung hinzufügen können.
/*backtest
start: 2019-07-01 00:00:00
end: 2019-08-24 00:00:00
period: 1h
exchanges: [{"eid":"Futures_OKCoin","currency":"BTC_USD"}]
args: [["IsSynthesisDayKL",true]]
*/

var chart0 = {
    __isStock: true,
    // /*
    extension: {
            layout: 'single',
            height: 300,
    },
    // */
    title : { text : 'Daily K-line chart'},
    xAxis: { type: 'datetime'},
    series : [
        {
            type: 'candlestick',
            name: 'r',
            id: 'r',
            data: []
        }
    ]
}

var chart1 = {
    __isStock: true,
    // /*
    extension: {
            layout: 'single',
            height: 300,
    },
    // */
    title : { text : 'EMA'},
    xAxis: { type: 'datetime'},
    series : [
        {
            type: 'candlestick',
            name: 'r1',
            id: 'r1',
            data: []
        }, {
            type: 'line',
            name: 'chart1_EMA1',
            data: [],
        }, {
            type: 'line',
            name: 'chart1_EMA2',
            data: []
        }
    ]
}

var chart2 = {
    __isStock: true,
    // /*
    extension: {
            layout: 'single',
            height: 300,
    },
    // */
    title : { text : 'MACD'},
    xAxis: { type: 'datetime'},
    yAxis : [
        {
            title: {text: 'price'},
            opposite: false
        }, {
            title:{text: "Indicator axis"},
            opposite: true,
        }
    ],
    series : [
        {
            type: 'candlestick',
            name: 'r2',
            id: 'r2',
            data: []
        }, {
            type: 'line',
            yAxis: 1,
            name: 'dif',
            data: []
        }, {
            type: 'line',
            yAxis: 1,
            name: 'dea',
            data: []
        }
    ]
}

function CreatePlotter (e, chart) {
    var obj = {}                      // Declare an empty object for adding methods in the following code, and finally return this object, that is, the constructed drawing object.

    obj.e = e                         // The reference to the exchange object passed by the parameter is assigned to a property of the obj object.
    obj.params = {}                   // Constructed parameters
    obj.params.EMA_param1 = 5         // We preset the parameters of some indicators on the chart to be used in the calculation of the indicator, for example, an EMA indicator line parameter.
    obj.params.EMA_param2 = 20        // The second EMA indicator line parameters, usually small parameters are called fast lines, large parameters are called slow lines.
    obj.params.MACD_fast = 12         // MACD parameter
    obj.params.MACD_slow = 26         // MACD parameter
    obj.params.MACD_sig = 9           // MACD parameter

    obj.runTime = {}                  // Used to store some data during runtime.
    obj.runTime.arrPreBarTime = [0, 0, 0]    // Store the timestamp of the previous bar of each K-line data for comparison.

    obj.GetAllRecords = function () {              // A method of the drawing object, used to get the K-line data, our example is used to display three charts at the same time, so, the function get three different periods of K-line data at the same time.
        obj.r = _C(obj.e.GetRecords, PERIOD_H1)    // The K-line data of the first chart, which is the 1-hour level K-line data.
        Sleep(1000)
        obj.r1 = _C(obj.e.GetRecords, PERIOD_M15)  // The K-line data of the second chart, which is the 15-minute level K-line data.
        Sleep(1000)
        obj.r2 = _C(obj.e.GetRecords, PERIOD_D1)   // The K-line data of the third chart, which is the daily level K-line data.
    }

    obj.Run = function () {                        // Execute the functions of drawing objects.
        obj.Plot()                                 // Execute the specific drawing code.
    }

    obj.CalcMACD = function (r, fast, slow, sig) {       // MACD indicator calculation function, return MACD indicator data.
        if (r.length <= Math.max(fast, slow, sig)) {
            return false
        }
        return TA.MACD(r, fast, slow, sig)
    }


    obj.Plot = function () {                   // Focus section with specific drawing code.
        obj.GetAllRecords()                    // Before each plot, update all K-line data first.
        var arr = [obj.r, obj.r1, obj.r2]      // Put all K-line data in an array and traverse it.
        var arrKIndex = [0, 1, 4]              // Indexing of K-line data series in chart objects.
        for (var i = 0; i < arr.length; i++) { // Traversal operations
            for (var j = 0; j < arr[i].length; j++) {
                if (arr[i][j].Time == obj.runTime.arrPreBarTime[i]) {    // When the last bar of the K-line data is not updated, we only update the data and do not add it. Note that when the chart.add function is called, the last parameter uses -1, which means that the data is updated and not added.
                    chart.add(arrKIndex[i], [arr[i][j].Time, arr[i][j].Open, arr[i][j].High, arr[i][j].Low, arr[i][j].Close], -1)

                   if (i == 1) {    // Update the EMA indicator data in the second chart.
                        var nowR = arr[i].slice(0, j + 1)
                        var ema1 = TA.EMA(nowR, obj.params.EMA_param1)
                        var ema2 = TA.EMA(nowR, obj.params.EMA_param2)
                        if (obj.r2.length <= obj.params.EMA_param1 || obj.r2.length <= obj.params.EMA_param2 || isNaN(ema1[j]) || isNaN(ema2[j])) {
                            continue
                        }

                        chart.add(2, [arr[i][j].Time, ema1[ema1.length - 1]], -1)
                        chart.add(3, [arr[i][j].Time, ema2[ema2.length - 1]], -1)
                    } else if (i == 2) {     // Update the MACD indicator data in the third chart
                        var nowR = arr[i].slice(0, j + 1)
                        var macd = obj.CalcMACD(nowR, obj.params.MACD_fast, obj.params.MACD_slow, obj.params.MACD_sig)
                        if (!macd) {
                            continue
                        }

                        var dif = macd[0]
                        var dea = macd[1]
                        chart.add(5, [arr[i][j].Time, dif[dif.length - 1]], -1)
                        chart.add(6, [arr[i][j].Time, dea[dea.length - 1]], -1)
                    }
                } else if (arr[i][j].Time > obj.runTime.arrPreBarTime[i]) {   // When the last bar of the current K-line data is larger than the last bar timestamp recorded previously, it indicates that a new bar has been generated for the K-line. At this time, a new bar and a new indicator data point should be added.
                    obj.runTime.arrPreBarTime[i] = arr[i][j].Time             // Update the record of the last bar timestamp for the next comparison. If the next timestamp is the same, data will not be added unless a new bar is generated.
                    chart.add(arrKIndex[i], [arr[i][j].Time, arr[i][j].Open, arr[i][j].High, arr[i][j].Low, arr[i][j].Close])
                    if (i == 1) {
                        var nowR = arr[i].slice(0, j + 1)
                        var ema1 = TA.EMA(nowR, obj.params.EMA_param1)
                        var ema2 = TA.EMA(nowR, obj.params.EMA_param2)
                        if (nowR.length <= obj.params.EMA_param1 || nowR.length <= obj.params.EMA_param2 || isNaN(ema1[ema1.length - 1]) || isNaN(ema2[ema2.length - 1])) {
                            continue
                        }

                        chart.add(2, [arr[i][j].Time, ema1[ema1.length - 1]])
                        chart.add(3, [arr[i][j].Time, ema2[ema2.length - 1]])
                    } else if (i == 2) {
                        var nowR = arr[i].slice(0, j + 1)
                        var macd = obj.CalcMACD(nowR, obj.params.MACD_fast, obj.params.MACD_slow, obj.params.MACD_sig)
                        if (!macd) {
                            continue
                        }

                        var dif = macd[0]
                        var dea = macd[1]
                        chart.add(5, [arr[i][j].Time, dif[dif.length - 1]])
                        chart.add(6, [arr[i][j].Time, dea[dea.length - 1]])
                    }
                }
            }
        }
    }
    obj.Plot()

    return obj
}

function main () {
    var chart = Chart([chart0, chart1, chart2])
    chart.reset()

    exchange.SetContractType("quarter")
    var plotter = CreatePlotter(exchange, chart)
    while (true) {
        plotter.Run()
        Sleep(1000)
    }
}
Wir beginnen mit dem Blick auf diemainFunktion:
function main () {                                  // Strategy entry function, of course, this strategy does not do anything, there are no transactions, just drawing charts.
    var chart = Chart([chart0, chart1, chart2])     // chart0, chart1, chart2 are pre-declared chart configuration objects, call the Chart function is to load the chart configuration, return a chart control object chart.
    chart.reset()                                   // Call the reset method of the chart control object chart to reset the chart.

    exchange.SetContractType("quarter")             // The backtest configuration is OKX futures, so here to set the contract, the contract is set to quarter.
    var plotter = CreatePlotter(exchange, chart)    // Call the CreatePlotter function to generate the plotter object -- plotter.
    while (true) {
        plotter.Run()                               // Execute drawing object plotter member function Run to draw.
        Sleep(1000)                                 // The drawing object plotter is responsible for "how to draw", and the chart control object chart is responsible for specific drawing. The former is implemented by our code, and the latter is the control object returned by the underlying API function of the system.
    }
}
Als nächstes können wir sehen, wie dieCreatePlotterWir können sehen, dass in dem Codevar plotter=CreatePlotter(exchange, chart), bei der Konstruktion eines Zeichnungsobjektplotters werden Austausch und Diagramm eingegeben. Der erste wird verwendet, um K-Liniendaten zu erhalten (durch Aufrufen von exchange.GetRecords), und der zweite wird verwendet, um das Diagramm zu bedienen und Daten zum Diagramm hinzuzufügen.
Der wichtigste Teil der Handlung ist diePlotKommentare wurden in den Code geschrieben.
Zurückprüfung:
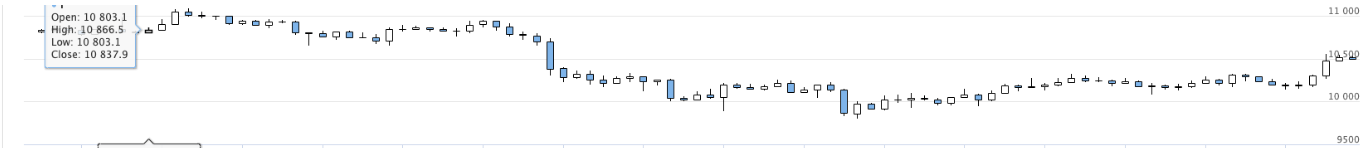
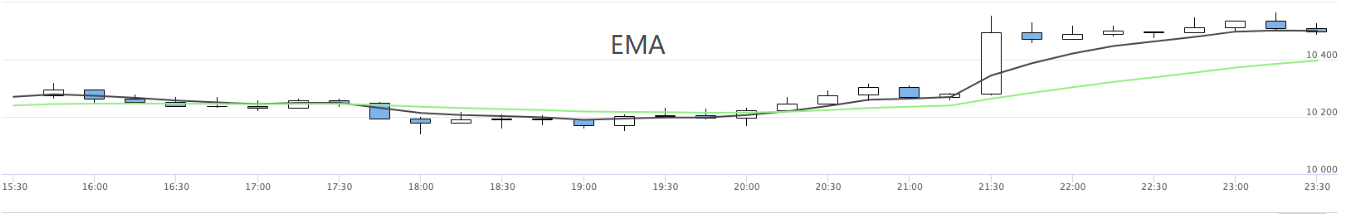
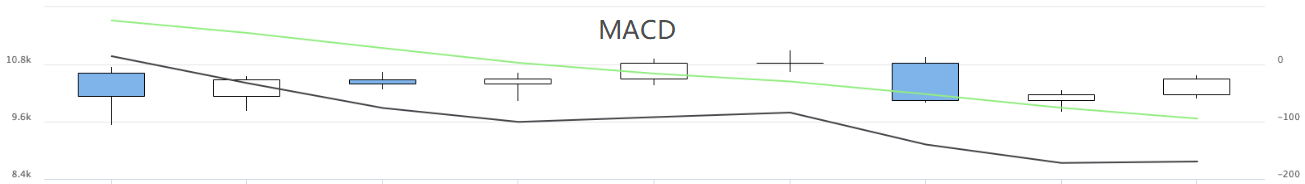
Auf diese Weise können mehrere Diagramme der Strategien angezeigt werden.
- Quantifizierung der Fundamentalanalyse auf dem Kryptowährungsmarkt: Die Daten sprechen für sich!
- Die Quantifizierung der Kernforschung der Münzkreise - nicht mehr auf alle Arten von Lehrern zu vertrauen, die überzeugt sind, dass die Daten objektiv sind!
- Ein wichtiges Werkzeug im Bereich der Quantitative Transaktionen - der Erfinder der Quantitative Data Exploration Module
- Mastering Everything - Einführung in FMZ Neue Version des Handelsterminals (mit TRB Arbitrage Source Code)
- Die neue Version des FMZ-Trading-Terminals ist verfügbar.
- FMZ Quant: Eine Analyse von gemeinsamen Anforderungen Designbeispielen auf dem Kryptowährungsmarkt (II)
- Wie man Hirnlose Verkaufs-Bots mit einer Hochfrequenz-Strategie in 80 Codezeilen ausnutzt
- FMZ-Quantifizierung: Analyse von Designbeispielen für häufige Bedürfnisse im Kryptowährungsmarkt (II)
- Wie man Hirnlose Roboter ausbeuten und verkaufen kann mit einer 80-Zeilen-code-Hochfrequenz-Strategie
- FMZ Quant: Eine Analyse von gemeinsamen Anforderungen Designbeispielen auf dem Kryptowährungsmarkt (I)
- FMZ-Quantifizierung: Analyse von Designbeispielen für häufige Bedürfnisse im Kryptowährungsmarkt