Anpassungsfähiger gleitender Durchschnitt der Steigung
Schriftsteller:ChaoZhang, Datum: 31.5.2022Tags:Die AMA
Einleitung
Dieses Skript ist inspiriert von
Trenderkennung Grüne Farbe Starker Aufwärtstrend mit guter Kursdynamik. Rote Farbe: Ein starker Abwärtstrend. Gelb: Der Markt ist entweder unruhig, seitwärts oder konsolidiert sich.
Voreinstellungen AMA-Länge ist 200 (Besser für Zeitrahmen größer als 1H) Kleine Länge ist 6 Die Hauptlänge beträgt 14 Die Steigungsperiode ist auf 34 mit 25 der Anfangsbreite festgelegt. Warnungen Best Entry ist bei absoluten Warnungen Timing, aber andere Trades können in der Mitte basierend auf Trend-Bedingung begonnen werden.
Zurückprüfung
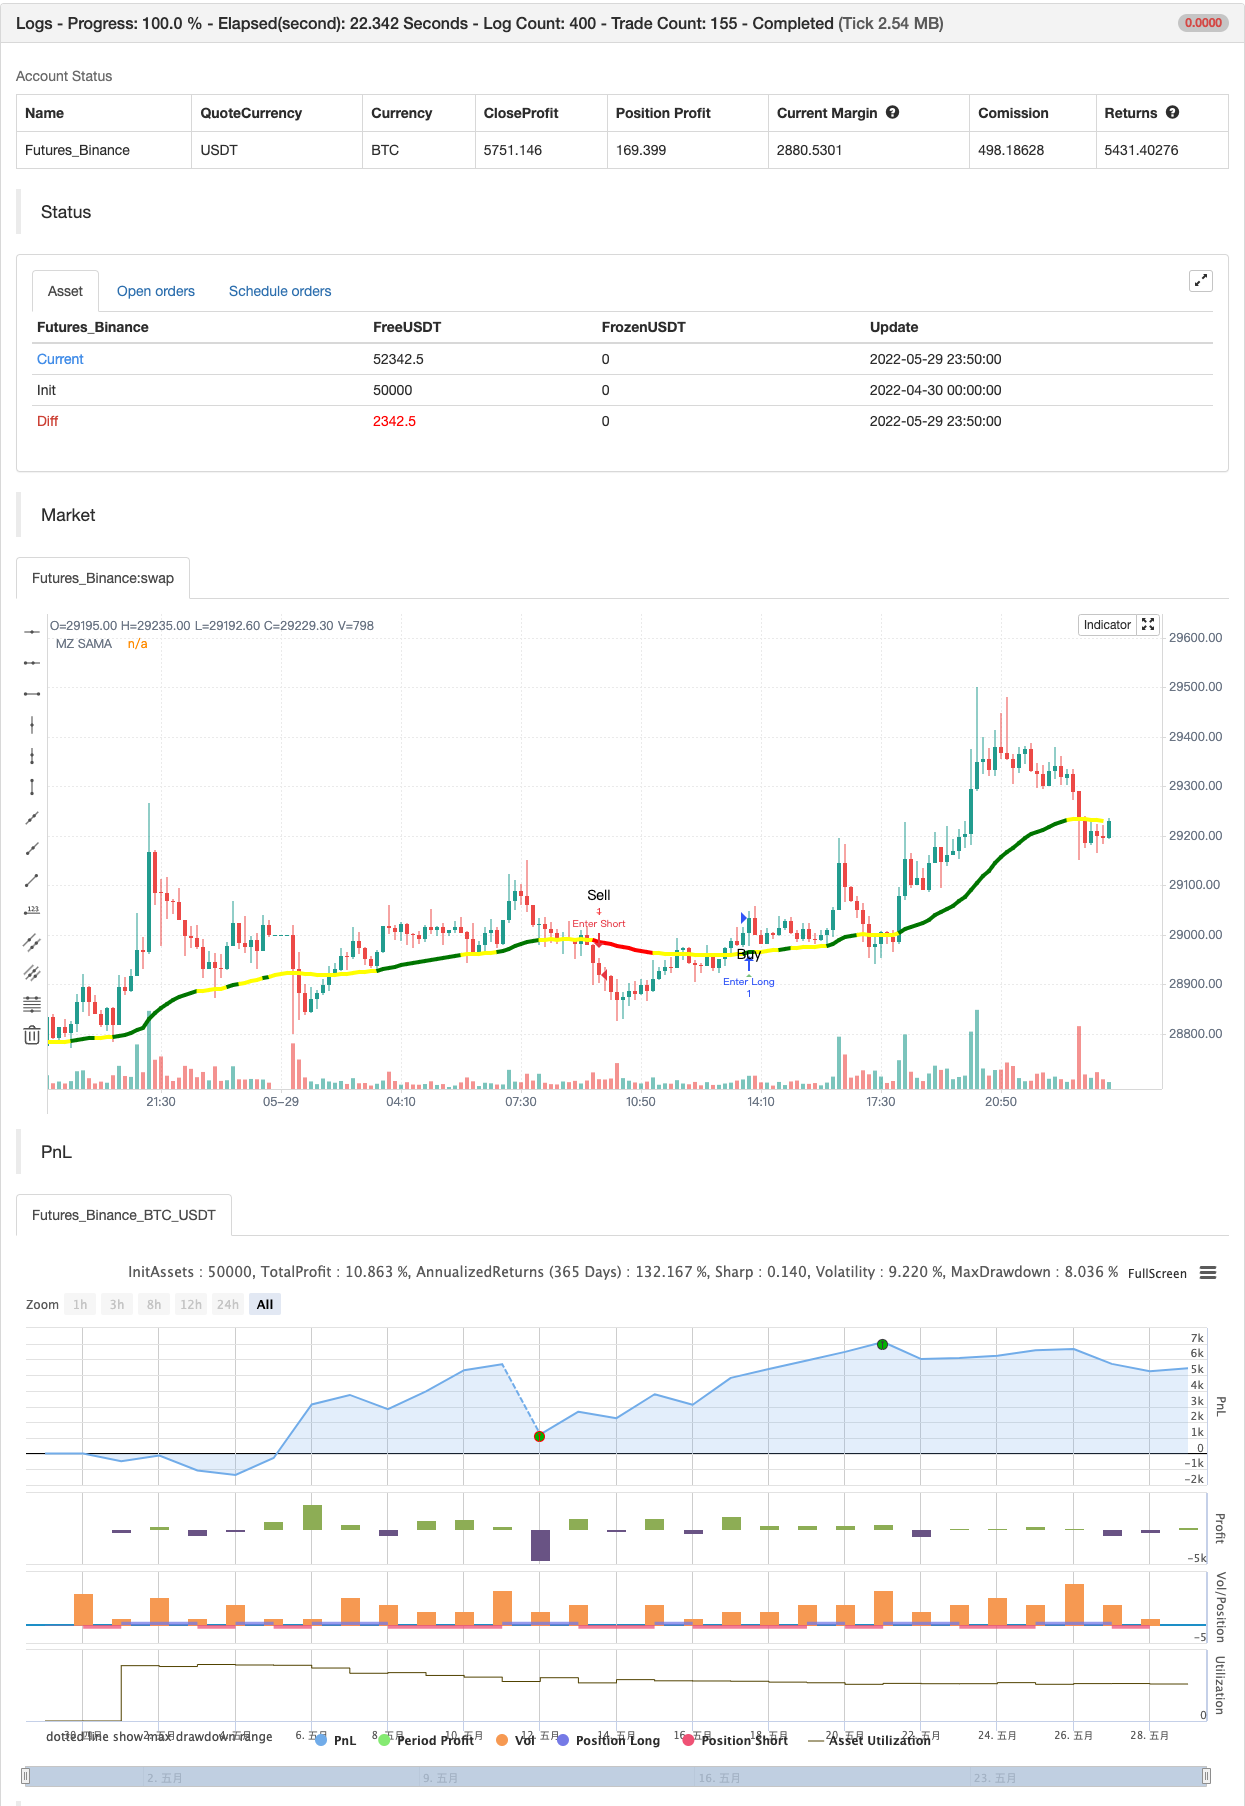
/*backtest
start: 2022-04-30 00:00:00
end: 2022-05-29 23:59:00
period: 10m
basePeriod: 1m
exchanges: [{"eid":"Futures_Binance","currency":"BTC_USDT"}]
*/

// This source code is subject to the terms of the Mozilla Public License 2.0 at https://mozilla.org/MPL/2.0/
// © MightyZinger

//@version=5

indicator('Slope Adaptive Moving Average (MZ SAMA)', shorttitle='MZ SAMA', overlay=true)

/////////////////////////////////////////////////////////////////////
/////////////////////////////////////////////////////////////////////
/////                        MZ SAMA                           //////
/////////////////////////////////////////////////////////////////////
/////////////////////////////////////////////////////////////////////

chartResolution = input.timeframe('', title='Chart Resolution')
src = input.source(close, 'Source')

// Length Inputs
string grp_1 = 'SAMA Length Inputs'
length = input(200, title='Adaptive MA Length', group = grp_1) // To check for Highest and Lowest value within provided period
majLength = input(14, title='Major Length', group = grp_1)     // For Major alpha calculations to detect recent price changes
minLength = input(6, title='Minor Length', group = grp_1)      // For Minor alpha calculations to detect recent price changes

// Slope Inputs
string grp_2 = 'Slope and Dynamic Coloring Parameters'
slopePeriod = input.int(34, title='Slope Period', group = grp_2)
slopeInRange = input.int(25, title='Slope Initial Range', group = grp_2)
flat = input.int(17, title='Consolidation area is when slope below:', group = grp_2)
bull_col = input.color(color.green, 'Bull Color  ', inline='dyn_col', group = grp_2)
bear_col = input.color(color.red, 'Bear Color  ', inline='dyn_col', group = grp_2)
conc_col = input.color(color.yellow, 'Reversal/Consolidation/Choppiness Color  ', inline='dyn_col', group = grp_2)

showSignals = input.bool(true, title='Show Signals on Chart', group='Plot Parameters')

//Slope calculation Function to check trend strength i.e. consolidating, choppy, or near reversal

calcslope(_ma, src, slope_period, range_1) =>
    pi = math.atan(1) * 4
    highestHigh = ta.highest(slope_period)
    lowestLow = ta.lowest(slope_period)
    slope_range = range_1 / (highestHigh - lowestLow) * lowestLow
    dt = (_ma[2] - _ma) / src * slope_range
    c = math.sqrt(1 + dt * dt)
    xAngle = math.round(180 * math.acos(1 / c) / pi)
    maAngle = dt > 0 ? -xAngle : xAngle
    maAngle

//MA coloring function to mark market dynamics

dynColor(_flat, slp, col_1, col_2, col_r) =>
    var col = color.new(na,0)
    // Slope supporting bullish uprtrend color
    col := slp > _flat ? col_1:
    // Slope supporting bearish downtrend color
         slp <= -_flat ? col_2:
    // Reversal/Consolidation/Choppiness color
         slp <= _flat and slp > -_flat ? col_r : col_r
    col

//AMA Calculations

ama(src,length,minLength,majLength)=>
    minAlpha = 2 / (minLength + 1)
    majAlpha = 2 / (majLength + 1)

    hh = ta.highest(length + 1)
    ll = ta.lowest(length + 1)

    mult = hh - ll != 0 ? math.abs(2 * src - ll - hh) / (hh - ll) : 0
    final = mult * (minAlpha - majAlpha) + majAlpha

    final_alpha = math.pow(final, 2) 		// Final Alpha calculated from Minor and Major length along with considering Multiplication factor calculated using Highest / Lowest value within provided AMA overall length
    var _ama = float(na)
    _ama := (src - nz(_ama[1])) * final_alpha + nz(_ama[1])
    _ama

// SAMA Definition
sama = request.security(syminfo.tickerid, chartResolution, ama(src,length,minLength,majLength))

// Slope Calculation for Dynamic Coloring
slope = calcslope(sama, src, slopePeriod, slopeInRange)

// SAMA Dynamic Coloring from slope
sama_col = request.security(syminfo.tickerid, chartResolution, dynColor(flat, slope, bull_col, bear_col, conc_col))

// SAMA Plot
plot(sama, 'MZ SAMA', sama_col, 4)


// BUY & SELL CONDITIONS AND ALERTS
_up = sama_col == bull_col
_downn = sama_col == bear_col
_chop = sama_col == conc_col
buy  = _up and not _up[1]
sell = _downn and not _downn[1]
chop_zone = _chop and not _chop[1]

_signal() =>
    var sig = 0
    if buy and sig <= 0
        sig := 1
    if sell and sig >= 0
        sig := -1
    sig

sig = _signal()

longsignal  = sig ==  1 and (sig !=  1)[1]
shortsignal = sig == -1 and (sig != -1)[1]

// Plotting Signals on Chart
atrOver = 1 * ta.atr(5)   // Atr to place alert shape on chart
plotshape(showSignals and longsignal  ? (sama - atrOver) : na , style=shape.triangleup, color=color.new(color.green, 30), location=location.absolute, text='Buy', size=size.small)
plotshape(showSignals and shortsignal ? (sama + atrOver): na , style=shape.triangledown, color=color.new(color.red, 30), location=location.absolute, text='Sell', size=size.small)

// Signals Alerts
alertcondition(longsignal, "Buy",  "Go Long" )
alertcondition(shortsignal, "Sell", "Go Short")
alertcondition(chop_zone, "Chop Zone", "Possible Reversal/Consolidation/Choppiness")

if longsignal
    alert("Buy at" + str.tostring(close), alert.freq_once_per_bar_close)
if shortsignal
    alert("Sell at" + str.tostring(close), alert.freq_once_per_bar_close)


if longsignal
    strategy.entry("Enter Long", strategy.long)
else if shortsignal
    strategy.entry("Enter Short", strategy.short)
- Darvas Box Kauf verkaufen
- Demark-Einstellungsindikator
- Bollinger-Bänder Stochastischer RSI Extreme
- Aktiengeschäft
- Parabolische SAR
- RSI-Divergenzindikator
- OBV-MACD-Indikator
- Pivot-Trend
- Preisdivergenzstrategie v1.0
- Unterstützungs-Widerstands-Ausbruch
- Der Ausgleichsbetrag für den Ausgleichsbetrag für den Ausgleichsbetrag für den Ausgleichsbetrag für den Ausgleichsbetrag
- Low Scanner Strategie Krypto
- [Blackcat] L2 Umkehrung Etiketten Strategie
- SuperB
- HIGH LOW SAR
- SuperTREX
- Spitzenmelder
- Niedriger Finder
- SMA-Trend
- Bollinger-Tiefpunkte