Mehrere Gleichgewichtspreistrendfolge- und Umkehrhandelsstrategien

ATR SL TP
Erstellungsdatum: 2024-12-13 10:23:12 zuletzt geändert: 2024-12-13 10:23:12
Kopie: 0 Klicks: 364
1
konzentrieren Sie sich auf
1617
Anhänger

Mehrere Gleichgewichtspreistrendfolge- und Umkehrhandelsstrategien

Strategieübersicht

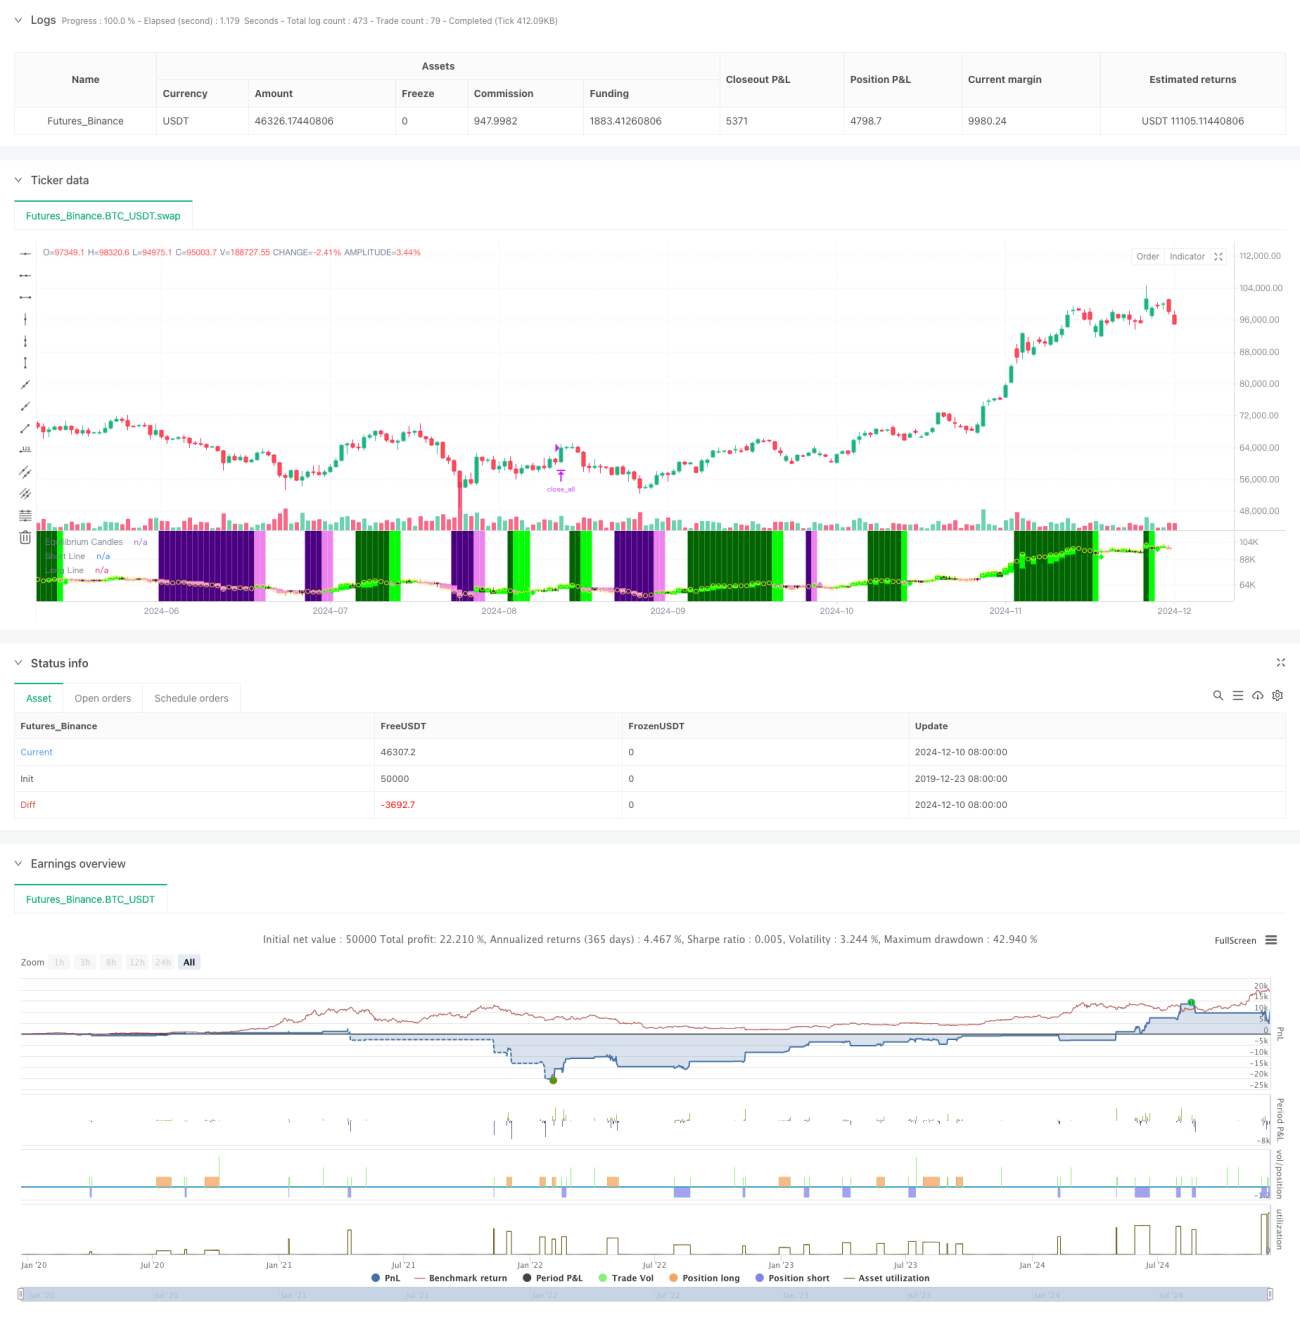
Die Strategie ist ein auf dem Preisgleichgewichtspunkt basierendes Trendverfolgungs- und Umkehrhandelssystem. Sie ermittelt den Gleichgewichtspreis durch Berechnung der Mittelwerte der Höchst- und Tiefpunkte der letzten X-Wurzel K-Linien und beurteilt die Trendrichtung anhand der Position des Schlusskurses in Bezug auf den Gleichgewichtspreis. Das System erkennt den Trend, wenn der Preis auf der Seite des Gleichgewichtspreises auf die festgelegte Anzahl von K-Linien hält.

Strategieprinzip

  1. Gleichgewichtspreisberechnung: Der Mittelpunkt zwischen dem höchsten und dem niedrigsten Preis der letzten X-Reihe K-Linie wird als Gleichgewichtspreis verwendet. Dies entspricht der Methode zur Berechnung der Basislinie in der Gleichgewichtsdiagramm.
  2. Trendbeurteilung: Der Kurs wird als Trend beurteilt, wenn er sich auf der gleichen Seite des Gleichgewichtskurses auf derselben Seite der X-Radical-K-Linie befindet (die Standard-7-Radical).
  3. Eintrittssignal: Eintrittssignal wird ausgelöst, wenn der Preis den ersten Rückschlag nach der Trendfeststellung erreicht (der Preis hat den Gleichgewichtspreis durchbrochen).
  4. Stop-Loss-Stopp: Die 60%-Punktzahl des ATR wird verwendet, um den Stop-Loss-Stopp-Abstand dynamisch anzupassen, um die Flexibilität der Risikokontrolle zu ermöglichen.
  5. Große Schwankungssicherung: Wenn der Kurs von der Gleichgewichtsgrenze abweicht und das gesetzte ATR-Mehrfach überschreitet, wird das System automatisch aufgelöst, um einen starken Rückzug zu verhindern.

Strategische Vorteile

  1. Anpassungsfähigkeit: Flexible Trend-Tracking und Umkehrung von Handelsmodellen je nach Marktcharakteristiken.
  2. Risikokontrolle: Dynamische ATR-Stoppschäden mit hoher Schwankungssicherheit.
  3. Operative Klarheit: Die Handelssignale sind klar und unabhängig von einer komplexen Kombination von technischen Indikatoren.
  4. Gute Visualisierung: Die Verwendung von farbigen K-Linien und Hintergründen bietet eine intuitive Darstellung der Marktlage.
  5. Automatisierungsfreundlich: Automatische Transaktionen können bequem mit Handelsplattformen wie MT5 durchgeführt werden.

Strategisches Risiko

  1. Das Risiko von Schwankungen: Bei schwankenden Märkten kann es zu häufigen Falschsignalen kommen.
  2. Einfluss der Gleitpunkte: Bei starken Schwankungen kann es zu einem größeren Gleitpunkt kommen.
  3. Parameter-Sensitivität: Die Kernparameter wie die Gleichgewichtsperiode, die Trendbeurteilungsperiode und andere müssen für verschiedene Märkte sorgfältig optimiert werden.
  4. Marktwechselrisiken: Eine Umstellung von einem Trend zu einem Erschütterungsmoment kann zu einem größeren Rückschlag führen.

Richtung der Strategieoptimierung

  1. Marktumfelderkennung: Hinzufügung eines Moduls zur Bewertung des Marktumfelds, um die Strategieparameter unter verschiedenen Marktbedingungen dynamisch anzupassen.
  2. Signalfilterung: Erwägen Sie, Hilfsindikatoren wie Verkehrsvolumen, Schwankungen usw. hinzuzufügen, um falsche Signale zu filtern.
  3. Positionsverwaltung: Einführung von komplexeren Positionsverwaltungsmechanismen, wie beispielsweise dynamische Anpassungen auf Basis von Volatilität.
  4. Mehrzeit-Zyklen: Integration von Signalen aus mehreren Zeiträumen zur Verbesserung der Genauigkeit des Handels.
  5. Optimierung der Transaktionskosten: Optimierung der Kostenmerkmale für verschiedene Transaktionsarten.

Zusammenfassen

Die Strategie zeichnet sich vor allem durch ihre hohe Flexibilität, die sowohl für Trend- als auch für Reverse-Trading genutzt werden kann. Sie verfügt über eine ausgereifte Risikokontrolle. Obwohl sie unter bestimmten Marktbedingungen herausgefordert werden kann, wird die Strategie durch kontinuierliche Optimierung und flexible Anpassung zu einer stabilen Performance in verschiedenen Marktumgebungen führen.

Strategiequellcode
/*backtest
start: 2019-12-23 08:00:00
end: 2024-12-11 08:00:00
period: 1d
basePeriod: 1d
exchanges: [{"eid":"Futures_Binance","currency":"BTC_USDT"}]
*/

// This Pine Script™ code is subject to the terms of the Mozilla Public License 2.0 at https://mozilla.org/MPL/2.0/
// © Honestcowboy

//@version=5
strategy("Equilibrium Candles + Pattern [Honestcowboy]", overlay=false)

// ================================== //
// ---------> User Input <----------- //
// ================================== //

candleSmoothing = input.int(9, title="Equilibrium Length", tooltip="The lookback for finding equilibrium.\nIt is same calculation as the Baseline in Ichimoku Cloud and is the mid point between highest and lowest value over this length.", group="Base Settings")
candlesForTrend = input.int(7, title="Candles needed for Trend", tooltip="The amount of candles in one direction (colored) before it's considered a trend.\nOrders get created on the first candle in opposite direction.", group="Base Settings")
maxPullbackCandles = input.int(2, title="Max Pullback (candles)", tooltip="The amount of candles can go in opposite direction until a pending trade order is cancelled.", group="Base Settings")
candle_bull_c1 = input.color(color.rgb(0,255,0), title="", inline="1", group="Candle Coloring")
candle_bull_c2 = input.color(color.rgb(0,100,0), title="", inline="1", group="Candle Coloring")
candle_bear_c1 = input.color(color.rgb(238,130,238), title="", inline="2", group="Candle Coloring")
candle_bear_c2 = input.color(color.rgb(75,0,130), title="", inline="2", group="Candle Coloring")
highlightClosePrices = input.bool(defval=true, title="Highlight close prices", group="Candle Coloring", tooltip="Will put small yellow dots where closing price would be.")
useBgColoring = input.bool(defval=true, title="color main chart Bg based on trend and entry point", tooltip="colors main chart background based on trend and entry points", group="Chart Background")
trend_bull_c = input.color(color.rgb(0,100,0,50), title="Trend Bull Color", group="Chart Background")
trend_bear_c = input.color(color.rgb(75,0,130, 50), title="Trend Bear Color", group="Chart Background")
long_zone_c = input.color(color.rgb(0,255,0,60), title="Long Entry Zone Color", group="Chart Background")
short_zone_c = input.color(color.rgb(238,130,238,60), title="Short Entry Zone Color", group="Chart Background")
atrLenghtScob = input.int(14, title="ATR Length", group = "Volatility Settings")
atrAverageLength = input.int(200, title="ATR percentile averages lookback", group = "Volatility Settings")
atrPercentile    = input.int(60, minval=0, maxval=99, title="ATR > bottom X percentile", group = "Volatility Settings", tooltip="For the Final ATR value in which percentile of last X bars does it need to be a number. At 60 it's the lowest ATR in top 40% of ATR over X bars")
useReverse = input.bool(true, title="Use Reverse", group="Strategy Inputs", tooltip="The Strategy will open short orders where normal strategy would open long orders. It will use the SL as TP and the TP as SL. So would create the exact opposite in returns as the normal strategy.")
stopMultiplier = input.float(2, title="stop+tp atr multiplier", group="Strategy Inputs")
useTPSL = input.bool(defval=true, title="use stop and TP", group="Strategy Inputs")
useBigCandleExit = input.bool(defval=true, title="Big Candle Exit", group="Strategy Inputs", inline="1", tooltip="Closes all open trades whenever price closes too far from the equilibrium")
bigCandleMultiplier = input.float(defval=1, title="Exit Multiplier", group="Strategy Inputs", inline="1", tooltip="The amount of times in ATR mean candle needs to close outside of equilibrium for it to be a big candle exit.")

tvToQPerc = input.float(defval=1, title="Trade size in Account risk %", group="Tradingview.to Connection (MT5)", tooltip="Quantity as a percentage with stop loss in the commands; the lot size is calculated based on the percentage to lose in case sl is hit. If SL is not specified, the Lot size will be calculated based on account balance.")
tvToOverrideSymbol = input.bool(defval=false, title="Override Symbol?", group="Tradingview.to Connection (MT5)")
tvToSymbol = input.string(defval="EURUSD", title="", group="Tradingview.to Connection (MT5)")
// ================================== //
// -----> Immutable Constants <------ //
// ================================== // 

var bool isBullTrend = false
var bool isBearTrend = false
var bool isLongCondition = false
var bool isShortCondition = false
var int bullCandleCount = 0
var int bearCandleCount = 0
var float longLine = na
var float shortLine = na

// ================================== //
// ---> Functional Declarations <---- //
// ================================== //

baseLine(len) =>
    math.avg(ta.lowest(len), ta.highest(len))

// ================================== //
// ----> Variable Calculations <----- //
// ================================== //

longSignal = false
shortSignal = false

equilibrium = baseLine(candleSmoothing)
atrEquilibrium = ta.atr(atrLenghtScob)
atrAveraged = ta.percentile_nearest_rank(atrEquilibrium, atrAverageLength, atrPercentile)
equilibriumTop  = equilibrium + atrAveraged*bigCandleMultiplier
equilibriumBottom = equilibrium - atrAveraged*bigCandleMultiplier

// ================================== //
// -----> Conditional Variables <---- //
// ================================== //
if not isBullTrend and close>equilibrium
    bullCandleCount := bullCandleCount + 1
    bearCandleCount := 0
    isBearTrend := false

if not isBearTrend and close<equilibrium
    bearCandleCount := bearCandleCount + 1
    bullCandleCount := 0
    isBullTrend := false

if bullCandleCount >= candlesForTrend
    isBullTrend := true
    isBearTrend := false
    bullCandleCount := 0
    bearCandleCount := 0
if bearCandleCount >= candlesForTrend
    isBearTrend := true
    isBullTrend := false
    bullCandleCount := 0
    bearCandleCount := 0

// ================================== //
// ------> Strategy Execution <------ //
// ================================== //

if isBullTrend[1] and close<equilibrium
    if useReverse and (not na(atrAveraged))
        strategy.entry("short", strategy.short, limit=high)
        alert("Sell " + str.tostring((tvToOverrideSymbol ? tvToSymbol : syminfo.ticker)) + " Q=" + str.tostring(tvToQPerc) + "% P=" + str.tostring(high) + " TP=" + str.tostring(high-stopMultiplier*atrAveraged)+ " SL=" + str.tostring(high+stopMultiplier*atrAveraged), freq=alert.freq_once_per_bar)
    if (not useReverse) and (not na(atrAveraged))
        strategy.entry("long", strategy.long, stop=high)
        alert("Buy " + str.tostring((tvToOverrideSymbol ? tvToSymbol : syminfo.ticker)) + " Q=" + str.tostring(tvToQPerc) + "% P=" + str.tostring(high) + " TP=" + str.tostring(high+stopMultiplier*atrAveraged) + " SL=" + str.tostring(high+stopMultiplier*atrAveraged), freq=alert.freq_once_per_bar)
    isLongCondition := true
    isBullTrend := false
    longLine := high

if isBearTrend[1] and close>equilibrium
    if useReverse and (not na(atrAveraged))
        strategy.entry("long", strategy.long, limit=low)
        alert("Buy " + str.tostring((tvToOverrideSymbol ? tvToSymbol : syminfo.ticker)) + " Q=" + str.tostring(tvToQPerc) + "% P=" + str.tostring(low) + " TP=" + str.tostring(low+stopMultiplier*atrAveraged) + " SL=" + str.tostring(low-stopMultiplier*atrAveraged), freq=alert.freq_once_per_bar)
    if (not useReverse) and (not na(atrAveraged))
        strategy.entry("short", strategy.short, stop=low)
        alert("Sell " + str.tostring((tvToOverrideSymbol ? tvToSymbol : syminfo.ticker)) + " Q=" + str.tostring(tvToQPerc) + "% P=" + str.tostring(low) + " TP=" + str.tostring(low-stopMultiplier*atrAveraged) + " SL=" + str.tostring(low+stopMultiplier*atrAveraged), freq=alert.freq_once_per_bar)
    isShortCondition := true
    isBearTrend := false
    shortLine := low

if isLongCondition and (bearCandleCount >= maxPullbackCandles)[1]
    if useReverse
        strategy.cancel("short")
        alert("Cancel " + str.tostring((tvToOverrideSymbol ? tvToSymbol : syminfo.ticker)) + " t=sell")
    if not useReverse
        strategy.cancel("long")
        alert("Cancel " + str.tostring((tvToOverrideSymbol ? tvToSymbol : syminfo.ticker)) + " t=buy")
    isLongCondition := false
    bullCandleCount := 0
    longLine := na

if isShortCondition and (bullCandleCount >= maxPullbackCandles)[1]
    if useReverse
        strategy.cancel("long")
        alert("Cancel " + str.tostring((tvToOverrideSymbol ? tvToSymbol : syminfo.ticker)) + " t=buy")
    if not useReverse
        strategy.cancel("short")
        alert("Cancel " + str.tostring((tvToOverrideSymbol ? tvToSymbol : syminfo.ticker)) + " t=sell")
    isShortCondition := false
    bearCandleCount := 0
    shortLine := na
    
// ---- Save for graphical display that there is a longcondition + reset other variables
if high>longLine
    longSignal := true
    longLine := na
    isLongCondition := false

if low<shortLine
    shortSignal := true
    shortLine := na
    isShortCondition := false
// ---- Get Stop loss and Take Profit in there
if useReverse
    if useTPSL
        if strategy.position_size < 0 and strategy.position_size[1] >= 0
            strategy.exit("short exit", "short", limit=longLine[1]-stopMultiplier*atrAveraged, stop=longLine[1]+stopMultiplier*atrAveraged)
        if strategy.position_size > 0 and strategy.position_size[1] <= 0
            strategy.exit("long exit", "long", limit=shortLine[1]+stopMultiplier*atrAveraged, stop=shortLine[1]-stopMultiplier*atrAveraged)
if not useReverse
    if useTPSL
        if strategy.position_size > 0 and strategy.position_size[1] <= 0
            strategy.exit("long exit", "long", limit=longLine[1]+stopMultiplier*atrAveraged, stop=longLine[1]-stopMultiplier*atrAveraged)
        if strategy.position_size < 0 and strategy.position_size[1] >=0
            strategy.exit("short exit", "short", limit=shortLine[1]-stopMultiplier*atrAveraged, stop=shortLine[1]+stopMultiplier*atrAveraged)
// ----- Logic for closing positions on a big candle in either direction
if (strategy.position_size[1]>0 or strategy.position_size[1]<0) and useBigCandleExit
    if close>equilibriumTop or close<equilibriumBottom
        strategy.close_all("Big Candle Stop")
        alert("close " + str.tostring((tvToOverrideSymbol ? tvToSymbol : syminfo.ticker)))

// ================================== //
// ------> Graphical Display <------- //
// ================================== //

// Deviation from equilibrium using smoothed ATR and percentile nearest rank to rank the coloring of the candles
candle_c2 = close>equilibrium ? close>open ? candle_bull_c1 : candle_bull_c2 : close<open ? candle_bear_c1 : candle_bear_c2
// 
plotcandle(equilibrium, high, low, close, title="Equilibrium Candles", color=candle_c2, wickcolor=candle_c2, bordercolor=candle_c2)
plotshape(highlightClosePrices ? close : na, title="Closing Bubble", style=shape.circle, location=location.absolute, color=color.yellow)
bgcolor(useBgColoring ? (isBullTrend ? trend_bull_c : isBearTrend ? trend_bear_c : isLongCondition ? long_zone_c : isShortCondition ? short_zone_c : na) : na, force_overlay=true)
plot(longLine, color=candle_bull_c1, title="Long Line", style=plot.style_linebr, linewidth=4)
plot(shortLine, color=candle_bear_c1, title="Short Line", style=plot.style_linebr, linewidth=4)
plotshape(longSignal ? math.min(equilibrium, low)+(-0.5*atrAveraged) : na, title="Long Signal", color=candle_bull_c1, style=shape.diamond, size=size.tiny, location=location.absolute)
plotshape(shortSignal ? math.max(equilibrium, high)+(0.5*atrAveraged) : na, title="Short Signal", color=candle_bear_c1, style=shape.diamond, size=size.tiny, location=location.absolute)

// =================================== //
// ------> Simple Form Alerts <------- //
// =================================== //

alertcondition(longSignal, "Simple Long Signal")
alertcondition(shortSignal, "Simple Short Signal")