The retest chart adds indicator auto-suggestion, and indicators and parameters used by the strategy can be displayed directly in the chart after retesting is complete.
Author: Zero, Created: 2016-04-14 18:30:51, Updated: 2016-05-06 16:56:56Retesting the automatic induction function of the indicator
Support for functions in the TA library
- EMA
- MA
- MACD
- KDJ
- RSI
- ATR
- OBV
- BOLL
- Alligator
- CMF
Explained
- A homogeneous line can render lines with up to 5 different cycles.
- MACD/KDJ/RSI share one position, ATR/OBV share one position
- BOLL and Alligator results will be shown on the K line chart, if these two indicators are used, the uniform line indicator will not be shown
- The parameters of the indicator are automatically fetched to the parameters used by the strategy during retesting and displayed on the chart after completion
Examples
For example, call strategy.
TA.EMA(records, 15);
Once the retest is complete, the EMA 15 cycle averages are shown on the chart.
TA.BOLL(records);
Once the retest is complete, the indicator of the Brin belt will be shown on the graph.
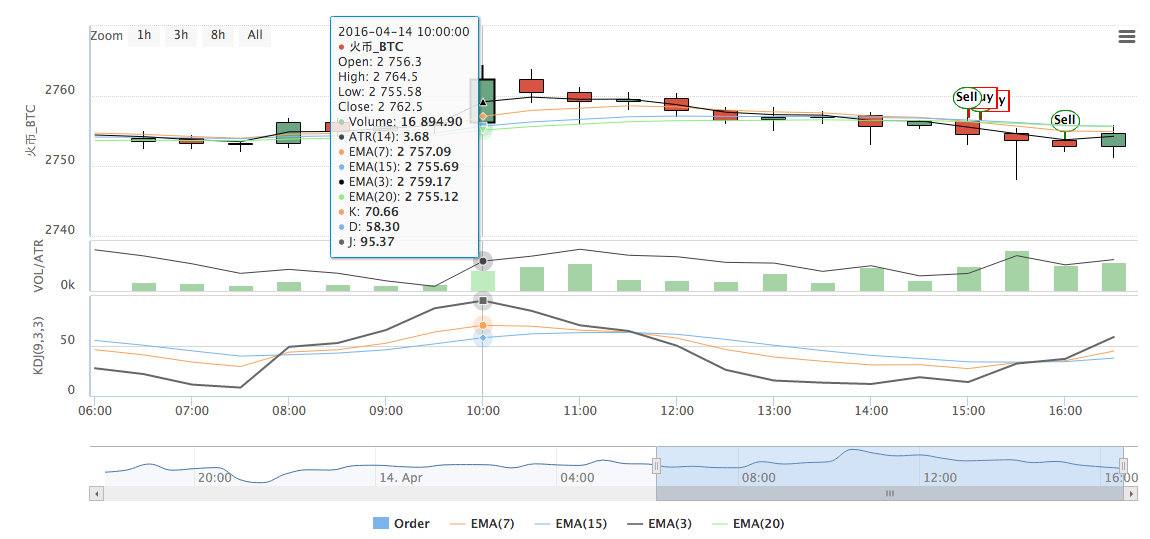
The following is the effect of the strategy using the KDJ indicator with three different cyclically even line indicators:
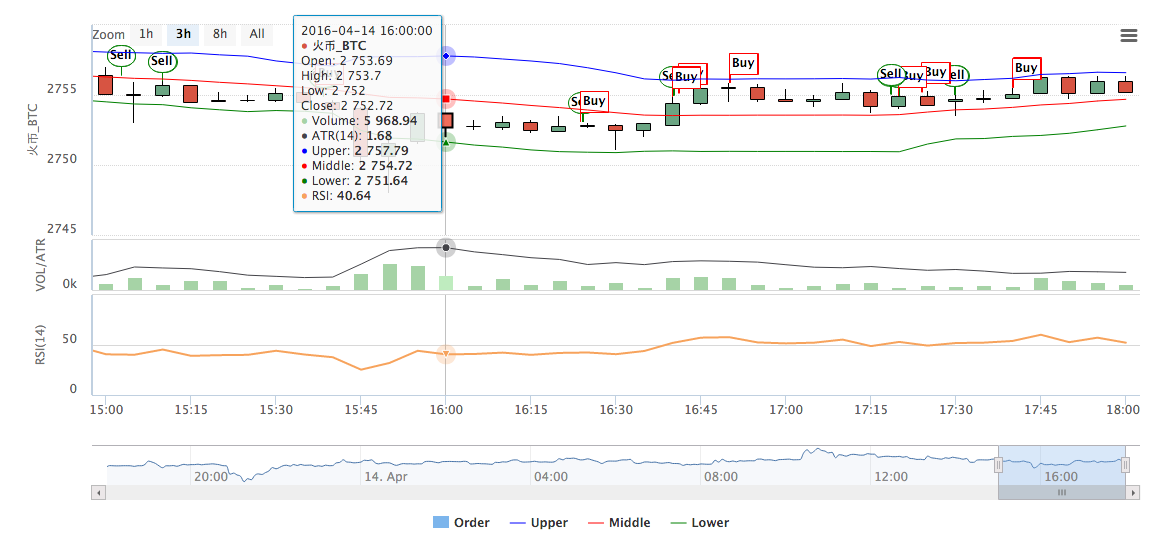
Below are the results of the strategy using the RSI and BOLL indicators
清空浏览器缓存, 刷新后回测即可使用该功能
More
- I'm going to ask you a technical question.
- BlockChain and Ethereum
- Do companies that do high-frequency and algorithmic trading actually operate in pursuit of complex mathematical strategies or simply technical analysis?
- Please teach all the good robots how to get record timeout.
- Order management, can you add an order time in the order structure?
- Some of the properties of the grid, throwing the cube.
- Inventors quantify that after half a month of sharing a manual intervention strategy, the robot can capture the code of the manual operation information.
- It takes you into the world of quantization -- MACD two-way operation, sliding stop-loss code analysis.
- Inventors Quantify: When will it be available?
- Icebreaker (original version) code analysis, please correct if there are errors.
- Bitcoin futures hedging strategy discussed
- Quantified trading starting line
- On the future review
- The 30 lines of code take you into the world of quantitative investing.
- We've got a list of the most popular sites on Github, and we've got a list of the most popular sites on Github.
- 。。
- You can select the range of the graph when retesting, but it won't work after the real disk (apparently a problem after hosting 3.0)
The short-line king won selling the high-price strategyProvide indicator functions that can be modified by the indicator function itself
The short-line king won selling the high-price strategyThis is great, can you add custom markers to the image yourself?
fmzeroCan we do it now?
Zero 还不能呢.