New student benefits, a simple chart template
Author: The Little Dream, Created: 2016-05-22 23:17:48, Updated:It's a simple graph template, and how to use it here is a simple introduction.
The first picture:

The reason for this is that when learning the double-slit strategy, there is no intuitive way to observe the open positions, the study of the flat positions, and the writing of the code, and the code is not intuitive when testing with the disk, and the return log headers are blurry. I wanted to write an intuitive display chart, based on the Z-size code example, I wrote a simple chart template, now the function is very simple, it only shows real-time K lines, shows open positions, break-even points. The indicators I have written show the complete line, shown in the K-line diagram, etc.), I intend to add it slowly. It's easy to use: There are two temporary export functions:
$.SignOP(time,price,amount,state)
$.Draw(records)
$.SignOP ((time, price, amount, state) This function is used immediately after the opening of the position to mark the opening of the position to the line K. There are four parameters. $.Draw ((records) This function is used to draw a string K. This function needs to be placed at the beginning of the policy's main loop, and the parameters can be passed to null, allowing the function itself to be obtained.
Below is an example of a 30-line code with a large Z, using this template to access code. Only three sentences were added to the code.
function main(){
   var STATE_IDLE = -1;//空闲状态
   var state = STATE_IDLE;
   var opAmount = 0;
   var initAccount = $.GetAccount();
   Log(initAccount);//输出账户初始信息
   while(true){
---------------------------------------------------------------------------------------------
       $.Draw(null);//  画图表K线
--------------------------------------------------------------------------------------------
       if(state === STATE_IDLE){
       	var n = $.Cross(FastPeriod,SlowPeriod);
       	if(Math.abs(n) >= EnterPeriod){
       		opAmount = parseFloat((initAccount.Stocks * PositionRatio).toFixed(3));
       		var obj = n > 0 ? $.Buy(opAmount) : $.Sell(opAmount);
       		if(obj){
       			opAmount = obj.amount;
       			state = n > 0 ? PD_LONG : PD_SHORT;
       			Log("开仓详情",obj,"交叉周期",n);
       		}
---------------------------------------------------------------------------------------------
               $.SignOP((new Date()).getTime(),obj.price,obj.amount,(n > 0 ? 1 : 2) ); //标记买入  卖出 开仓
---------------------------------------------------------------------------------------------
       	}
       }else{
       	var n = $.Cross(ExitFastPeriod,ExitSlowPeriod);
       	if(Math.abs(n) >= ExitPeriod && ((state === PD_LONG && n < 0 ) || (state === PD_SHORT && n > 0))){
       		var obj  =  state === PD_LONG? $.Sell(opAmount) : $.Buy(opAmount);
---------------------------------------------------------------------------------------------
               $.SignOP((new Date()).getTime(),obj.price,obj.amount,0); //标记平仓
---------------------------------------------------------------------------------------------
       		state = STATE_IDLE;
       		var nowAccount = $.GetAccount();
       		LogProfit(nowAccount.Balance - initAccount.Balance,"钱:",nowAccount.Balance,"币:",nowAccount.Stocks,"平仓详情:",obj,"交叉周期",n);
       	}
       }
       Sleep(Interval*1000);//暂停10秒
   }
}
K-line graphs generated by the system
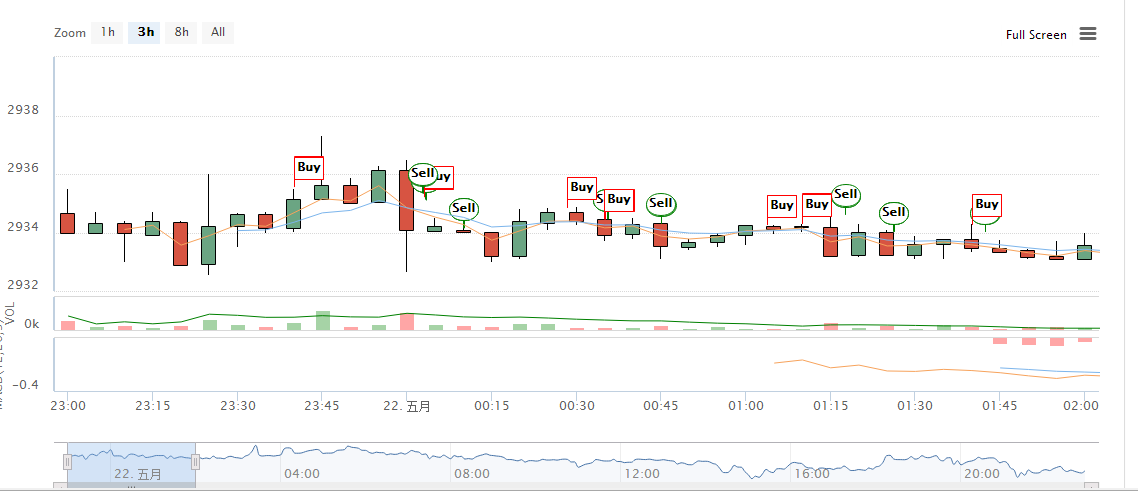
K-line graph drawn from template

The code is not yet perfect, welcome to the big god axe, perfect.
- How do you know the current market and get the latest prices?
- Can you add a little bit of functionality to improve the experience?
- The day of the quantitative trader: Hiss vs. Gao Fuqiang
- I'd like to draw another graph of the yield.
- Golang wrote the transaction API third-party library, welcome to start, fork, and maintain together
- 请问talib.STOCHRSI如何才能取得和bitcoinwisdom一样的值
- Trading mindsets: timing of entry and exit AND classification processing of trading strategies
- CTP Commodity Futures SimNow simulation disc configuration (teachable patch)
- Recent thoughts on Bitcoin Quantitative Trading
- The inventor's diary of quantum chemistry (a) completed
- The inventor's quantitative chemistry diary (II) (completed)
- Can commodity futures give the historical K line?
- rsi indicator function
- Details on the use of the Mail () API
- We have written a test code for users to learn how to use it, throwing quotes and quotes.
- The impact of the initial account on the earnings calculation of the strategy of the company.
- How can I get a fair price based on the order id?
- I'm going to ask you a technical question.
- BlockChain and Ethereum
- Do companies that do high-frequency and algorithmic trading actually operate in pursuit of complex mathematical strategies or simply technical analysis?
leilmlGood for you!
The Little DreamContinue improving~~ to make our platform better.~~