Quantified trading strategies for the CCI indicator
Author: The Little Dream, Created: 2017-02-04 10:16:01, Updated: 2019-08-01 09:22:03Quantified trading strategies for the CCI indicator
In the 1980s, American stock market analyst Donald Lambert invented the trend indicator, the CCI, which was initially used for futures market judgments and later widely used in stock market research. Compared to most technical analysis indicators, the CCI, which is based on statistical principles, is unique in that it predicts the trend of stock price changes by measuring whether stock price fluctuations have gone beyond their normal range. The CCI, like other technical analysis indicators, differs due to the calculation cycle used, which includes: minute CCI indicator, daily CCI indicator, weekly CCI indicator, annual CCI indicator and many other types. Of these, daily, weekly CCI indicator is more commonly used in stock market research.
The calculation of CCI indicators is more complex compared to other technical analysis indicators, with two calculation methods used to calculate the daily CCI:
-
1.CCI = (TP-MA)÷MD÷0.015
In this case, TP = ((highest price, lowest price, closing price) ÷ 3; MA = the cumulative sum of the closing prices of the most recent N days ÷ N; MD = cumulative sum of the most recent N days (MA- closing price) ÷N; 0.015 is the computation coefficient, and N is the computation period.
-
2.中价与中价的N日内移动平均的差÷N日内中价的平均绝对偏差
In this case, the median price = ((highest price + lowest price + closing price) ÷ 3; The mean absolute deviation is a statistical function.
The CCI indicator differs from other indicators that do not have operational zone restrictions in that it has a relative technical reference zone, which can be divided into three categories according to the market's standard of circulation: between +100, -100 and +100 tonnes-100:
-
1. When the CCI is >+100, it indicates that the share price has entered the overbought range and it is necessary to pay more attention to the volatility of the share price;
-
2. When the CCI is <-100, indicating that the stock price has entered the oversold range, investors can absorb the stock at a low;
-
3. When the CCI is between +100 and -100, indicating that the stock price is in the normal range of the narrowly oscillating range, investors should be cautious.
-
-
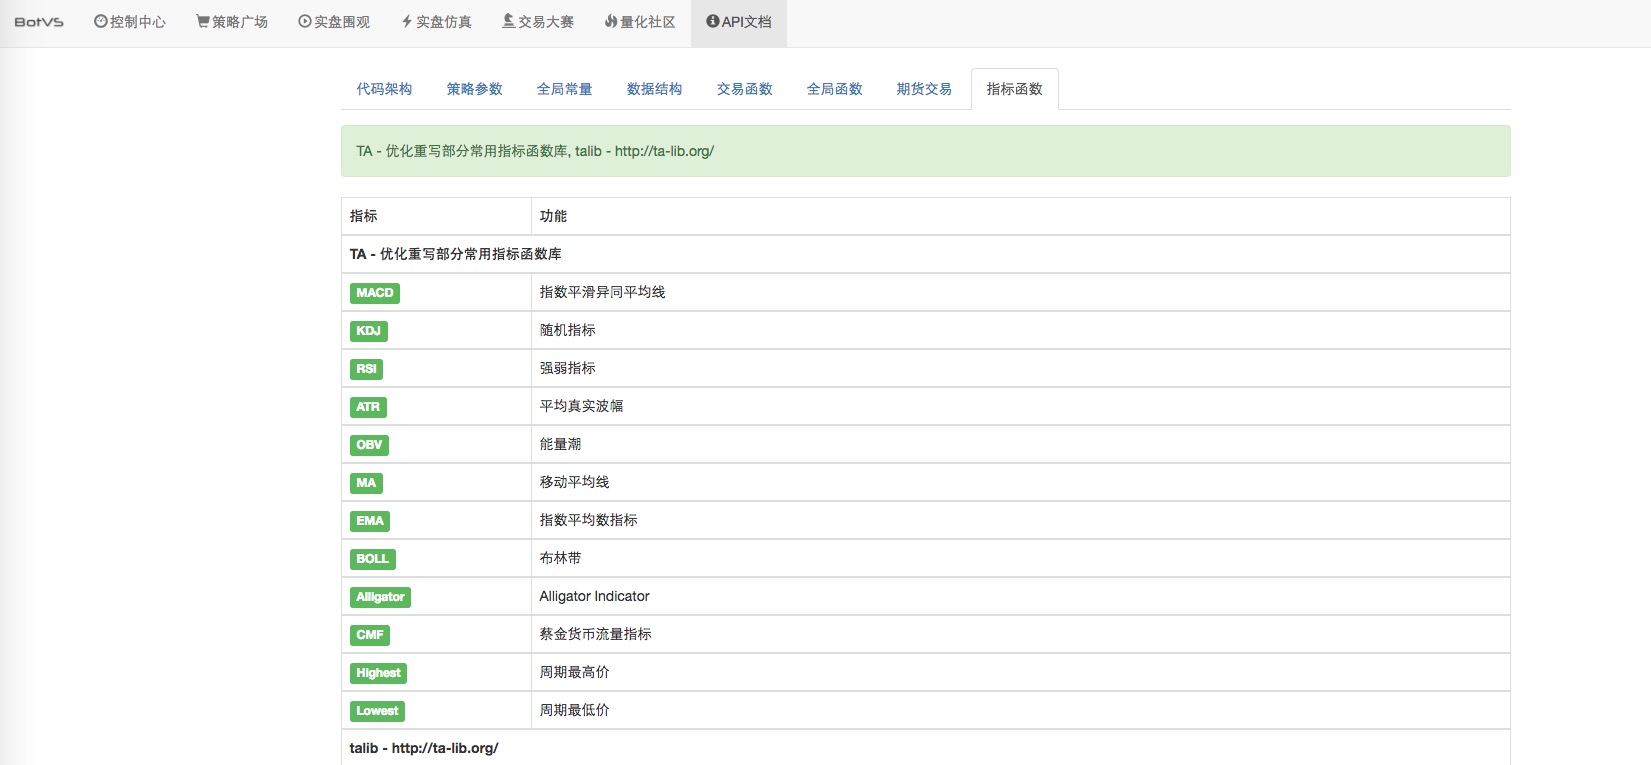
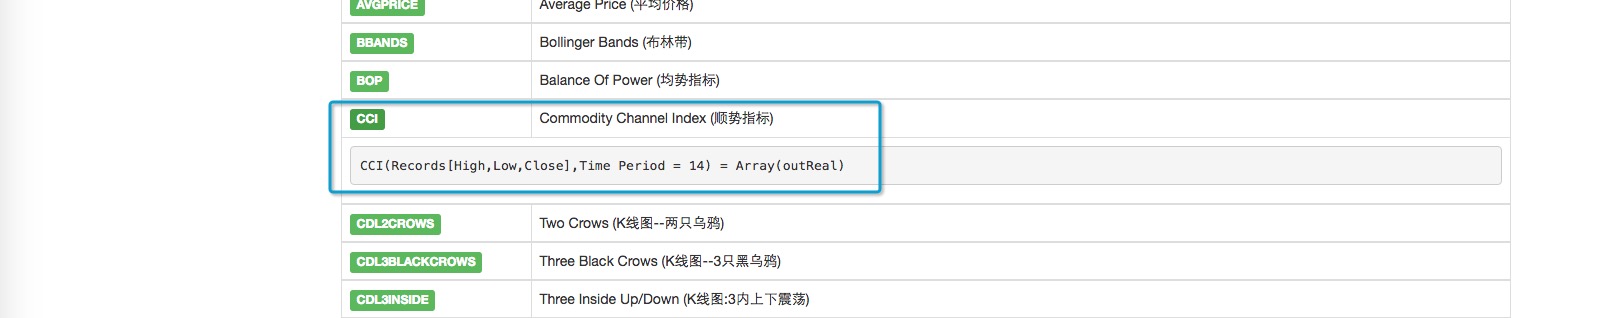
Inventors quantify the built-in indicator library
Translated from Programmatic Trader
- China's four largest futures exchanges exposed
- 1.4 Futures Basics of knowledge
- Not support market order error
- Inventors describe the mechanism of quantitative analogue level retesting
- The K-Line is not compatible with mainstream channels.
- Quantitative trading "reverse investment from the mean to the return"
- I've been reading a lot about equity, counter-equity, the profit formula, the gambler's loss theorem (very inspiring).
- The Deutsche Bank study notes several common mistakes in the quantification strategy
- Bitcoin contracts for okcoin: the dollar-renminbi exchange rate problem
- The more complex the method, the more it deviates from the essence of the transaction.
- Commodity futures reassessment price changes are not continuous
- About data storage
- Summary of fees related to digital currency exchanges ((updated on 02/13/2017))
- English comparison of common quantitative terms, trading terms, and terms
- He is the key step to open systematization and short line high frequency trading.
- Ask for help: How to get the opening and closing prices of a k-line
- Synthesis of 4-hour K-string function ((First throw the cube, later give the code for synthesis of arbitrary cycle)
- Bitcoin trading platforms cancel funding of the coin
- The 10 most puzzling economics myths
- What are the basic functions a qualified trader should have? (comprehensive, complete)