Playing JavaScript with the old man - creating a buyer/seller partner (5)
Author: The Little Dream, Created: 2017-03-13 12:53:50, Updated: 2017-10-11 10:37:32Playing JavaScript with the old man, creating a partner who will buy and sell.
A tutorial on how to write a quantum robot using JS:https://www.fmz.com/bbs-topic/705(First under Mark)
-
1, The data basics of the K-line, The problems of using this data in quantitative transactions.
-
What is K-line data:
The K-line chart was originally used by Japanese grain traders to record the market and price fluctuations in the grain market, and was later introduced to the stock market and futures market due to its subtle and unique labeling. Today, this chart analysis method is especially popular in China and throughout Southeast Asia. Because the chart shape drawn in this way resembles a chicken with black and white dots, it is also called a sunline chart. Through the K-line chart, we can record the performance of the market on a daily basis or for a certain period. (Question from Baidu)
Without explaining the specific graph, let's look at the data structure of the K-string defined using the JS language:
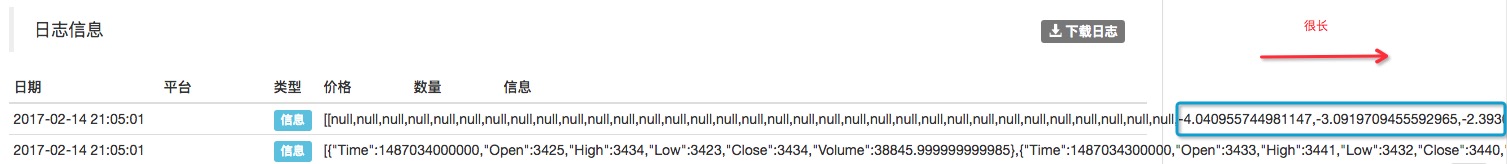
{
    Time    :   1487034000000, // 一个时间戳, 精确到毫秒,与Javascript的 new Date().getTime() 得到的结果格式一样
    Open    :   3425,          // 开盘价
    High    :   3446,          // 最高价
    Low     :   3423,          // 最低价
    Close   :   3438,          // 收盘价
    Volume  :   177657.99,     // 交易量
}
Let's look at the data obtained by calling the GetRecords function: (remember to call exchange.SetContractType ((
rb1705 ); clearly the type of contract to be operated) [ {"Time":1487034000000,"Open":3425,"High":3446,"Low":3423,"Close":3438,"Volume":177657.9999999999}, {"Time":1487035800000,"Open":3438,"High":3448,"Low":3382,"Close":3385,"Volume":494882}, {"Time":1487037600000,"Open":3385,"High":3398,"Low":3383,"Close":3394,"Volume":83656.00000000015} ]The K-line data is an array of objects, each of which is a K-line bar, containing the highest price, the lowest price, the opening price (i.e. the price at the beginning of the K-line time frame), the closing price (i.e. the price at the end of the K-line time frame), and the transaction volume (i.e. the transaction volume in the cycle). For example, how does the data in the above array determine how big a period the K line is? The result is: 1800000, the unit of this value is the millisecond, so the conversion: 1800000 / 1000 / 60 = 30 (minutes), this K line cycle is 30 minutes.
The first easy question is: When using K-line data, the array length is ignored. This causes array access overflow (this type of BUG was common when writing C programs before). For example, getting a K-line: exchange.SetContractType ((
rb1705 ); // Switch settings for the 1705 contract of screw steel. var records = exchange.GetRecords ((); // Obtain the default K-line cycle data for the rb1705 threaded steel contract. The number of K-bars that can be accessed depends on the API of the exchange. So if you need more K-bars at the beginning, you have to let the program collect for a while. if(records.length < n){ // n 就是我们限定的 n线数量。 return; // 当前函数返回。 }The second easy question is: The data in the last Bar of the K-line, in addition to the Time attribute, Open attribute, and the Close attribute, can be changed in real time. Beginners can be confused by not understanding this point when dealing with the K line. For example, in the previous chapter, we talked about the equilateral intersection.
The third question: The period of the K-line, the time stamp is the start time of this cycle, the time stamp is a millisecond, the value of the time stamp is 0. The time stamp represents January 1, 1970 (when writing a specific program, it is also necessary to consider the time zone). The following sentence can be used inw3schoolOr try using BotVS Sandbox system:
var arr = new Date(0);It is shown as:
Thu Jan 01 1970 08:00:00 GMT+0800 (CST) // Indicated as Eight time zone This value has been added up from 1970 to the present (every 1 second adds 1000, because 1 second is 1000 milliseconds), so this value is already relatively large. Here's a little trick: Since the timestamp is unique to each Bar in the K-line of the determined K-line cycle, once the timestamp changes, you can be sure to receive the latest K-line data. This is also useful in actual processing of K-line data.
-
-
2, Indicator call details, frequently encountered problems, satisfying cycles, return values, parameters
A number of indicator functions are also used when writing a programming or quantification policy. A more useful indicator library is the talib library, which has various versions, we use the JS version here.
There were also many errors when the old man first used the index library functions:
-
First, the parameter cycle (indicator parameter, distinguished from the K line cycle, how much is the K line cycle, the calculated indicator K line cycle is how much, for example, 30 minutes K line calculated is the MACD indicator of 30 minutes cycle, parameters for parameter cycle) set too large, K line data length is insufficient: The MACD indicator, for example, describes:
MACD(Records[Close],Fast Period = 12,Slow Period = 26,Signal Period = 9) = [Array(outMACD),Array(outMACDSignal),Array(outMACDHist)]If the parameter period is set to 12, 26, 9 when used, we import the K-line data records used to calculate the indicator, and the code reads like this:
var macd = talib.MACD(records, 12, 26, 9);If the records are too small at this time, the following is calculated:
[
  [null,null,null,null,null,null,null,null,null,null,null,null,null],
  [null,null,null,null,null,null,null,null,null,null,null,null,null],
  [null,null,null,null,null,null,null,null,null,null,null,null,null]
]
This is because the K-line data is insufficient, and the calculated indicator will cause a BUG if used, so we added a limiting condition before the program:
while(!records || records.length < 50){
    records = exchange.GetRecords();
    Sleep(1000);
}
Jump out of the loop until you get enough K-strings.
A careful reader can see why the data calculated by this indicator is a two-dimensional array (i.e. each element of an array is an array), because the MACD indicator is calculated not by a line, but by three lines: dif, dea, macd column. So the return value of each indicator may be different, or you need to look at the description of the indicator.
[
  [null,null,null,null,null,null,null,null,数据...],
  [null,null,null,null,null,null,null,null,数据...],
  [null,null,null,null,null,null,null,null,数据...]
]
In some cases, the return structure of the indicator is ignored, causing a BUG.
-
Second, the mean of the indicator functions used for computation is different or the indicator algorithms used result in different results.
The STOCH RSI indicator, which is described as follows:
STOCHRSI(Records[Close],Time Period = 14,Fast-K Period = 5,Fast-D Period = 3,Fast-D MA = 0) = [Array(outFastK),Array(outFastD)]This calculated value is significantly different from other algorithms, which I have given my own algorithm code in the first chapter of this series. Interested readers can compare below. This may be due to inconsistencies in the uniform linear system used, some libraries using MA and some using EMA. Some indicators are iteratively calculated every day, and if the number of K-line data is different, there may be differences in the values calculated.
-
-
3, API allowed for error handling
-
Cannot read property
length of null This bug is the most frequently occurring, not one of them. The reason is that the API sometimes has a data acquisition error, or no data acquisition for various reasons. In this case, some APIs for data acquisition get a null value. These data are generally array structures, often requiring access to the length of the array.
All API calls require error tolerance, and sometimes even the need to test if the data is normal (sometimes there are abnormal data). Our programs can only guarantee accuracy within their own code, but for data information that runs on the network, it is not guaranteed to be 100% accurate (what is unavoidable), so it is necessary to erroneously process the acquired data and filter out all abnormal data.
This is because there is no single-step debugging, no interrupt debugging, no variable value monitoring, etc. I usually debug using the simplest logarithm! Logs can be used to log text, analyze the output of the program. It is possible to understand the process of running the program, or to use try, catch, throw JS to handle bugs, but my recommendation is not to use them when you have to use exception capture. For DEBUG, using the most primitive Log method is indeed an experience, which is very effective from the point of view of developing DEBUG capabilities.
-
Before I write this, welcome readers to leave me a message! Send me your suggestions and comments, if you feel like it's fun, you can share it with more friends who love the program and love the deal.
https://www.fmz.com/bbs-topic/728
Programmer littleDream originally created
- No prediction, only reflection of price changes
- Ali Cloud Linux host is running the host, the host restarted, how to get back to the original host?
- High volatility means high risk? Value investing defines risk differently than you think.
- I wanted to ask you about the platforms that virtual currency disks can support and the currencies that can be traded.
- Zero and negative markets
- Playing JavaScript with old people - creating a buyer/seller tool (7) Useful tool to know why!
- Playing JavaScript with the old man - creating a buyer/seller partner and developing the tool code used by the robot
- High-frequency trading strategies talk - do the market versus the reverse option
- Becoming a probabilist - a random strolling idiot who reads books
- Positive expectations for probabilities, odds and long-term trades
- Playing JavaScript with the old man - creating a partner who will do the buying and selling (4) teaching him a little simple knowledge (even-line applications)
- Playing JavaScript with the old man - creating a buyer/seller partner (3) A lively little guy who likes fresh things around
- I'm going to ask the gods about my doubts about future functions!
- Playing JavaScript with the old man - creating a partner who buys and sells - born in a sandbox
- Playing JavaScript with the old man - creating a partner who will buy and sell 1) The boring life of a front-end middle-aged farmer
- Money and credit in monetary banking
- Futures trading: The pursuit of perfect certainty is a toxin in the trading system!
- Trading strategies of gamblers
- HttpQuery is not used in Python
- What does it mean to be a "dispossessed" hedge fund?