Dongjian Tunnel (formerly known as the Turtle System)
Author: The Little Dream, Created: 2017-07-05 18:16:02, Updated: 2017-11-04 14:56:29A summary of the trading system
The Donchian channel strategy is considered the ancestor of all intraday strategies. The earliest known version of the Donchian channel was developed in 1970 by an American company that conducted a simulation and comparison study of the most popular mechanical trading system at the time. The results showed that the Donchian channel rule was the most successful of all the test subjects. The rules of the Dongjian channel are: do more when the highest price is higher than the highest price of the previous X Ks; do nothing when the lowest price is lower than the lowest price of the previous X Ks. If you want to optimize for how many Ks backwards, you will find that different markets will get different results, even the best value in the same market at different times. Why is the default X 20? This is another iconic magic number. During the development of the Donchian channel, Donchian happened to read a 1960 paper by orthopedic surgeon Dr. Maxwell Maltz on the psychological control of acne (which was rediscovered in 1989). Dr. Maltz said that during orthopedic surgery, it takes at least 21 days for patients to see their new appearance; and many of the phenomena I have observed show that it takes at least 21 days for new things to replace old things.
伪代码:
//策略:唐奇安通道
//类型:皆可
//版本:1.0
//中间变量
INPUT:X(20,1,100,1),nmin(10,1,100,1),ss(1,1,100,1);
X周期高点:=ref(hhv(h,X),1);//X是参数,自行调整
X周期低点:=ref(LLV(L,X),1);
手数:=ss;
开仓时间:=time>opentime(1) and time<closetime(0)-nmin*100;
平仓时间:=time>=closetime(0)-nmin*100;
{nmin为参数,closetime(0)-nmin*100表示 收盘时间-提前N分钟 N由nmin控制}
//交易条件:
开多平空条件:=C>X周期高点 and 开仓时间 and holding<=0;
开空平多条件:=C<X周期低点 and 开仓时间 and holding>=0;
//交易系统
收盘平多:sell(平仓时间 and holding>0, 0, thisclose);
收盘平空:sellshort(平仓时间 and holding<0,0,thisclose);
平空:sellshort(开多平空条件 and holding<0, 手数,limitr,X周期高点);
平多:sell(开空平多条件 and holding>0,手数,limitr,X周期低点);
开空:buyshort(开空平多条件 and holding=0,手数,limitr,X周期低点);
开多:buy(开多平空条件 and holding=0, 手数,limitr,X周期高点);
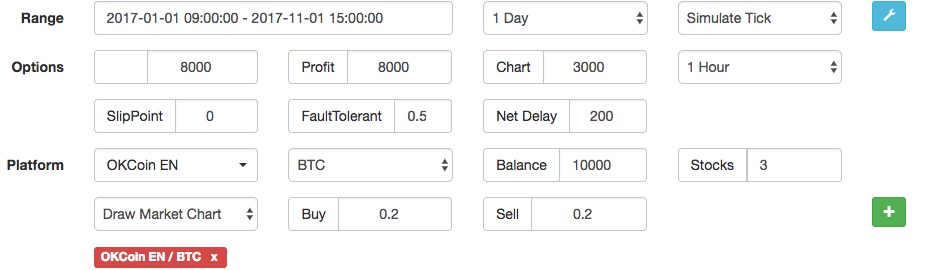
本文以日内策略为例,但是这个策略不限于在日内使用。交易条件中去掉开仓时间、平仓时间项,即可作为中长线策略。
写本文的目的有2个。
1、这个策略是现有众多策略的鼻祖,以此为基础的变种策略玲琅满目。重要的是学习其思想。
2、为之后发布的动态突破II策略(The Dynamic Break Out II)做技术储备。
There is a related article: The article is longer and interested friends can read it.
The pioneers of the trend tracking system
-
The insight of traders
A trader should be wary of repeated price movements; they are likely to have similar results with high probability.
In the 1970s, I invented a trading plan based on time variables, entry variables, and risk variables. I still don't fully understand how this design works, but good trades come up often. I formed my own style by learning the methods of other successful traders and turning them into something I was used to. For example, my basic market intuition was established through a 1980 article by Richard Donchian on the subject of agricultural products and a book by orthopedic surgeon Dr. Maxwell Maltz.
We all talk about trends being your friend, but very few of us actually base our trades on trends and consider them as the main consideration for trading. I want to emphasize two things; how to judge trends and how to use them to trade.
The key to the problem is to know when the reversal will end and the market will return to the main trend. My observation is that the reversal usually lasts for about 15 days. Taking that as a premise, I see a potential turning point.
I was inspired to read Dr. Maxwell Maltz, a plastic surgeon, in his 1960 paper on the psychological control of acne (which was rediscovered in 1989) about changing a person's image. Dr. Maltz says that it takes at least 21 days for a patient to see their new face during plastic surgery. Many of the phenomena I have observed show that it takes at least 21 days for something new to replace something old.
I was shocked by the fact that 21 natural days equals 15 trading days! While the vast majority of traders think the trend may have changed (they think they see a new color in the market), the main trend is ready to continue.
We all have our habits, and we all know what makes us feel comfortable, because it usually benefits us in many ways. However, for a futures trader, a successful plan often includes the possibility that it can cause a lot of anxiety or discomfort. If you are a trader, you have no doubt recognized that your decisions will usually be irritating because they are not the best.
How to use this method to build a trading plan? Take a technical book and look at the market trends (the trends that the 10-week moving average shows us); identify those phased lows in the chart during the downtrend. Take these dates as a starting point and observe the market movements of the 15th trading day after them, you can see that the reversal usually lasts for 15 trading days, and then the market starts to resume the main trend.
Usually, the best way to re-enter the main trend is to be in the market when the trend starts. I prefer to have the bear market restart before it has actually reached a new price low. The 15-day time cycle gives you an alarm signal.
-
Application of channel indicators
The technique of constructing an envelope based on a moving average is one of the current trend-tracking analytical techniques that can effectively eliminate short-term market pull phenomena. There are many ways to construct such a channel, and the vast majority of analytics software provides a channel indicator calculated with the moving average as a benchmark.
Many tests have shown that the channel indicator is one of the most effective of many technical indicators, and perhaps the most famous study in this regard is Merrill Lynch's Frank Hochheimer's Channel Breakout theory from 10 years ago. In addition to Hochheimer, many well-known traders have also studied the value of the channel indicator, such as Richard Donchian, who is known for his use of the even-line system, while he also used his Four-week Rule for channel trading.
We think that there are many interesting practical applications for channel technology to build a profitable trading system. We will divide our discussion into two sections: the first section is about channel technology based on a straight line structure; the second section is about channel breakout systems.
-
Section 1: Transactions based on channel analysis
The construction of a channel indicator can be both simple and complex. The simplest channel indicator can be a median line based on a moving average, which is then used as a benchmark for a horizontal vertical gradient, a buffer zone within the region of the channel that in most cases includes price movements. Generally, when a new trend begins, the price breaks out of the channel, adjusts in the trend, or when the trend ends, the price returns to the channel and moves to the moving average.
Another example of a simple channel indicator is a horizontal symmetry with an absolute point number, which is used to measure the risk that traders originally assume when trading, rather than as any buy or sell point. The two channel indicators have almost infinite variations, for example, the ordinary moving average can be changed to a weighted moving average or other. In addition, the scale of the horizontal symmetry can also be adjusted accordingly based on the length of the market cycle analyzed, resulting in a difference in the magnitude of the vibration of the channel.
Another possibility is to create a channel based on the daily highs and lows of the market, which contains the actual range of price movements, which may indicate a trend reversal once there are signs of a price breakout.
A relatively new example is the Bollinger Bands and the Alpha-Beta-Bollinger Bands. Both indicators are calculated on the basis of short moving averages. Computer software first calculates a simple moving average and then calculates the standard deviation of the two parallel moving averages on the basis of which the standard deviation of the Bollinger bands is calculated. Bollinger explains how this channel is well suited for most price movements, and notes that the channel is sensitive to market movements when it is opened or closed rapidly.
The choice of channel width is theoretically based on the magnitude of market volatility, and the use of these self-adjusting channels means that the channel width can be widened when the market amplitude is high and automatically narrowed when the market amplitude is low.
General trading rules for channel indicators
The trading rules of the channel are basically the same as the rules by which it is constructed, i.e. the price inside or outside the channel determines the trading behavior.
-
The general rules of channel trading are:
1, Open a new position when the price breaks the channel, which indicates the beginning of the trend change; close the position or create a new one when the price breaks the other channel.
2 - Open a new position when the price breaks through the channel, which marks the beginning of the trend change; close the position when the price breaks through the channel in the opposite direction.
These two rules ensure a grasp of the main trends in the market, the first rule being the most basic, and a pure reverse trading system, but we are skeptical of the reverse trading system, so we prefer the second rule because it can better control the trading risk compared to the first rule.
Parameters for the optimal percentage of channels
Determining the parameters for the correct averages and channels is a hassle, and the most detailed tests we've seen in this period are from 1960 to 1978. In December 1983 the journal Futures Market Research published an article by Irwin and Uhrig, who used the above 2nd rule for testing, optimizing for the best combination parameters, and calculating the optimal return scenario. See the figure in the table below:
Commodities Uniform parameters % of channel parameters Corn 45 3.2 Soybean 20 4.0 Wheat 39 4.2 White sugar 36 4.8 Copper 39 1.0 Cocoa 43 6.2
Trading in the Corridor
We rarely see any discussion of using the channel as an overbought overbought indicator, in which case the trade will take place inside the channel, rather than when the price breaks through the channel. We and some other traders have made a lot of profit using this approach when the market is in a cross-trend. Comparatively, the trading rules are much simpler: buy when the price hits the channel, stop when the price breaks if the market exceeds expectations, profit when the price rises in the channel, and vice versa.
So how do you know when the market is in a horizontal operation? A more objective way is to use the ADX indicator on the 18th, if the ADX indicator is up and the value is greater than 25, then the market should be in a unilateral trend operation, you should use a trend-tracking channel indicator to trade. If the ADX is down and below 25, then it is good to use the in-channel trading method.
-
-
Section 2: Breakthroughs by channel
In addition to the technical construction of channels based on moving average gradient indicators, there is also a method of constructing channels based on high and low internal market prices over a periodic period. This method, in its simplest form, belongs to a pure reversal system and is more widely used in the market.
The method of constructing this channel indicator is: the trajectory of the production channel according to the highs of the first 10 trading days; the trajectory of the production channel according to the lows of the first 10 trading days; the curves of the two up and down tracks make up the entire channel indicator.
The width of this channel indicator changes with the upward and downward movements of the highs and lows of the previous market period. Holds a multi-head position when the market price breaks the channel up, holds a blank position when the price breaks down, and moves to establish an opposite blank position when the multi-head position ends at the same time.
Donchian popularized this trading system with his weekly rule technique (Izul note: a form of channel indicator) in 1960. He used a four-week time frame, buying when the market price broke the near-four-week high and selling when the market price fell the near-four-week low.
Bruce Babcock published his research test results on the four-week rule in his Dow Jones-Irwin Guide. He found that the Donchian method, while not working well when the market was in a pull, was still able to maintain good profits in most cases.
As you can imagine, a four-week time scale can be used to capture risk over any given time frame. In addition to the trading risk of individual trading positions, the entire trading system greatly increases market risk due to the lack of a stop-loss risk control mechanism.
Another thing worth noting is that Bruce Babcock's test included a loss of $43,000 in S&P 500 index trading. This is not unusual, and we and some other traders have found that the S&P index market is performing a little differently than other futures.
The Tempus formula was a popular and expensive trading system in the 1980s, with the same basic rules as the Around-the-Clock rule, but with system parameters optimized for different commodity futures markets. After years of trading profits, the market's pull in 1988 caused many users to lose heavily and had to stop using it.
Select the time parameter
What are the optimal time parameters for constructing a channel-breaking trading system? We have some of the following parameters optimized for Hochheimer's results mentioned in the first half of this article:
Commodities Trading day Commodities Trading day Cocoa 18 and peas 57 Corn 38 Wheat 22 White sugar 40 Pork 38 Cotton 70 Bean oil 42 Silver 4 Copper 29 Soybean 51 alloy plate 48
The above optimization parameters were proven to be profitable in a 6-year (1970-1976) trading test; however, even with these optimization results, only 42% of trades would be profitable. It is important to know that the market often experiences pull-ups, and with the silver channel trading system with a parameter of 4, it produced a total of up to 1,866 trades in the test (a few trades per trading day).
It is easy to apply the parameters of the optimum number to channel trading systems, but in our experience these systems are also prone to crash. As Bruce Babcock shows in his test report on the rule of four, a single number can be effectively applied to many different markets, but the fact is that the profitability of the entire trading system is excellent if S&P indicates that period trading is not included in the trading test.
William Gallacher, in his book The Winner Takes All: A Privateer's Guide to Commodity Trading, provides his background tests of 10 different commodity markets based on a 130-week 10-channel trading system. The test results show that the annual return on this simple 10-channel trading system is around 24%.
Our own extensive research and testing has shown that the 18th is a good time parameter, which can be valid for a long time in many commodity markets. Our view is that any number within this time range of 10-30 days is a useful parameter and can generally bring profits. With changes in the time parameter, the timing and extent of the pull phenomenon produced by the indicator also varies.
Use neutral zones to reduce trading risk
A fund manager in Southern California has proposed a method that can both reduce the pull that occurs in the channel indicator and not diminish the potential profitability of the indicator. His trading system uses different time parameters for entry and exit, and the time parameter for his exit indicator is half that of the entry indicator, i.e. if the entry point of the soybean market is a near 20-day high when the market price breaks, the exit point is set at a near 10-day low when the market price falls.
This has a great advantage over the Donchian trading system in controlling market risk, which creates a neutral zone in the channel, which is by nature detached from the category of a pure reversal trading system, which is not only better able to prevent the pull phenomenon that occurs in the market under irregular fluctuations, but also allows a faster exit when the market trend turns downward, thus retaining more profits.
- Indices: Please ask about the market for OKEX contracts, is there an index?
- Multi-platform hedge stability of the leverage V2.1 (note)
- Bitcoin is open for ETC trading, inventors quantify, when will ETC support?
- Don't miss out on the advances and breakthroughs in technology!
- Can deep learning be used to quantify transactions?
- The depth of the OKEX futures Why only get 5?
- Pandora's Box: How financial traders eat risk-free fat
- Newcomer's Question. GetRecords obtained K-line data and the chart of the retest and the actual data are inconsistent.
- Hot summer, tokens and inventors quantify join hands, 5 discount invites you to start quantified trading
- TableTemplate from Python
- Maximizing trading: Theoretical boundaries and trading systems
- How to customize the set of currencies not shown on the exchange label when creating a digital currency trading robot
- The LogStatus function shown in the Python interface
- The LogStatus function shown in the Python interface
- Exchange fee summary
- Project templates that write their own TypeScript policies, need to be customizable
- Inventors Quantify: Is the editor theme available for download?
- Settings for remittance fees
- Python simplified the multi-variety MACD trend strategy framework (note)
- TableTemplet Template for the status bar of the table (note)